. 2009 Aug;5(8):e1000602.
doi: 10.1371/journal.pgen.1000602. Epub 2009 Aug 14.

Aging and environmental exposures alter tissue-specific DNA methylation dependent upon CpG island context

Affiliations

Aging and environmental exposures alter tissue-specific DNA methylation dependent upon CpG island context

Brock C Christensen et al. PLoS Genet. 2009 Aug.

Abstract

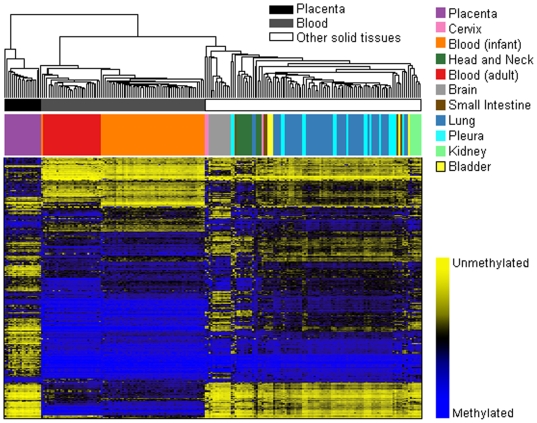
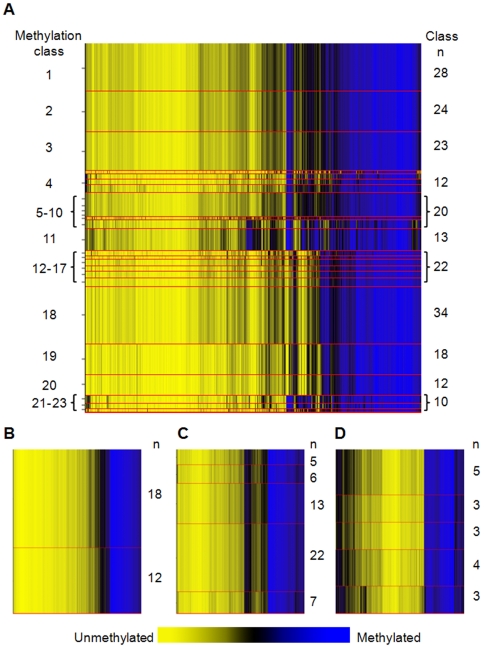
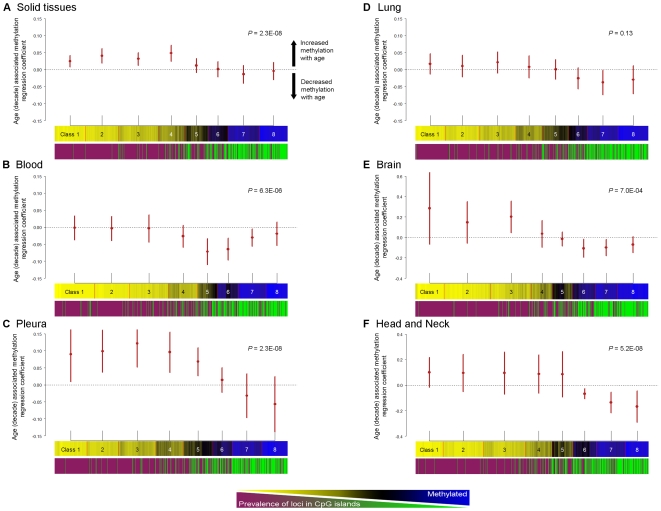
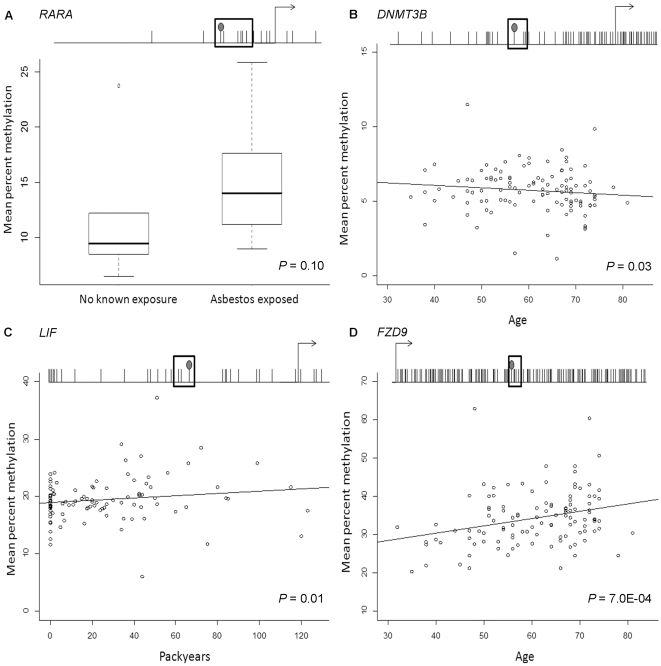
Epigenetic control of gene transcription is critical for normal human development and cellular differentiation. While alterations of epigenetic marks such as DNA methylation have been linked to cancers and many other human diseases, interindividual epigenetic variations in normal tissues due to aging, environmental factors, or innate susceptibility are poorly characterized. The plasticity, tissue-specific nature, and variability of gene expression are related to epigenomic states that vary across individuals. Thus, population-based investigations are needed to further our understanding of the fundamental dynamics of normal individual epigenomes. We analyzed 217 non-pathologic human tissues from 10 anatomic sites at 1,413 autosomal CpG loci associated with 773 genes to investigate tissue-specific differences in DNA methylation and to discern how aging and exposures contribute to normal variation in methylation. Methylation profile classes derived from unsupervised modeling were significantly associated with age (P<0.0001) and were significant predictors of tissue origin (P<0.0001). In solid tissues (n = 119) we found striking, highly significant CpG island-dependent correlations between age and methylation; loci in CpG islands gained methylation with age, loci not in CpG islands lost methylation with age (P<0.001), and this pattern was consistent across tissues and in an analysis of blood-derived DNA. Our data clearly demonstrate age- and exposure-related differences in tissue-specific methylation and significant age-associated methylation patterns which are CpG island context-dependent. This work provides novel insight into the role of aging and the environment in susceptibility to diseases such as cancer and critically informs the field of epigenomics by providing evidence of epigenetic dysregulation by age-related methylation alterations. Collectively we reveal key issues to consider both in the construction of reference and disease-related epigenomes and in the interpretation of potentially pathologically important alterations.


Conflict of interest statement

The authors have declared that no competing interests exist.

Figures

Figure 1
Figure 1. Unsupervised clustering of average beta values in normal human tissues.
Normal tissue sample average beta values were subjected to unsupervised hierarchical clustering based on Manhattan distance and average linkage. Each column represents a sample and each row represents a CpG locus (500 most variable autosomal loci). Above the heatmap, colors indicate tissue type as in key. In the heat map blue = average β of one, or methylated, and yellow = average β of zero, or unmethylated.
Figure 2
Figure 2. Recursive partitioning mixture models (RPMM) of methylation profiles in normal tissuses.
Methylation average β is yellow for unmethylated and blue for methylated. Methylation profile classes are stacked in rows separated by red lines, and class height corresponds to the number of samples in each class. Class methylation at each CpG locus is a mean of methylation for all samples within a class. (A) Methylation profile classes significantly differentiate all normal tissue types (n = 217, P<0.0001). (B) Methylation profile classes from RPMM of adult bloods, class membership is significantly associated with age (P<0.005, n = 30). (C) Methylation profile classes from RPMM of lung tissue samples (n = 53). (D) Methylation profile classes from RPMM of pleural samples (n = 18).
Figure 3
Figure 3. The direction of correlations for age associated methylation alterations differ dependent upon CpG island status.
For (A–F), the top plot is the estimate of mean regression coefficients for age associated methylation (by decade), and its 95% confidence interval from GEE for each CpG RPMM class. The middle plot is of CpGs clustered with RPMM into eight classes for each group of samples. The bottom plot indicates the CpG island status for each locus (where magenta = CpG island locus, green = non-CpG island locus). (A) Estimates of class-specific age-associated methylation among all solid tissues (n = 119), RPMM clustering of CpGs, and CpG island status. Age-associated methylation is significantly increased among classes with a high prevalence of CpG-island loci (P = 2.3E-08). (B) Estimates of class-specific age-associated methylation among blood samples (n = 29), RPMM clustering of CpGs, and CpG island status. Age-associated methylation is significantly decreased among classes with a high prevalence of non-CpG-island loci (P = 6.3E-06). (C) Estimates of class-specific age associated methylation among pleural tissues (n = 18), RPMM clustering of CpGs, and CpG island status. Age-associated methylation is significantly increased among classes with a high prevalence of CpG-island loci (P = 2.3E-08). (D) Estimates of class-specific age-associated methylation among lung tissues (n = 52), RPMM clustering of CpGs, and CpG island status. (E) Estimates of class-specific age-associated methylation among brain tissues (n = 11), RPMM clustering of CpGs, and CpG island status. Age-associated methylation is significantly increased for the predominantly CpG island loci in class 3, and significantly decreased among classes with a high prevalence of non-CpG-island loci (P = 7.0E-04). (F) Estimates of class-specific age associated methylation among head and neck tissues (n = 10), RPMM clustering of CpGs, and CpG island status. Age-associated methylation is significantly decreased among classes with a high prevalence of non-CpG-island loci (P = 5.2E-08).
Figure 4
Figure 4. Bisulfite pyrosequencing confirmation of age and environmental exposure–related methylation alterations observed in array results.
Each plot displays the gene transcription start site and surrounding CpGs are indicated by tick marks where the array CpG tick mark has a filled circle on top, and the sequenced CpGs are surrounded by a box. (A) Distribution of mean bisulfite pyrosequencing percent methylation for RARA_P176 and five downstream CpGs (79 bases total) stratified by known exposure to asbestos in DNA from pleural samples (n = 16) confirms the observation from array results of increased methylation at this locus among individuals with a known asbestos exposure (P = 0.10). (B) Mean bisulfite pyrosequencing percent methylation of DNMT3B_P352 and two downstream CpGs (30 bases total) in adult bloods run on the array and an independent set of controls plotted versus age (P = 0.03, rho = ––0.18, n = 112). (C) Mean bisulfite pyrosequencing percent methylation of LIF_P383 and two downstream CpGs (41 bases total) in adult bloods run on the array and an independent set of controls plotted versus smoking packyears (P = 0.01, rho = 0.24, n = 112). (D) Mean bisulfite pyrosequencing percent methylation of FZD9_E458 and five downstream CpGs (25 bases total) in adult bloods run on the array and an independent set of controls plotted versus age (P = 7.0E-04, rho = 0.29, n = 112).

References

    1. Russo V, Martienssen RA, Riggs AD. Cold Spring Harbor Laboratory Press; 1996. Epigenetic mechanisms of gene regulation.
    1. Feinberg AP, Tycko B. The history of cancer epigenetics. Nat Rev Cancer. 2004;4:143–153. - PubMed
    1. Amir RE, Van den Veyver IB, Wan M, Tran CQ, Francke U, et al. Rett syndrome is caused by mutations in X-linked MECP2, encoding methyl-CpG-binding protein 2. Nat Genet. 1999;23:185–188. - PubMed
    1. Xu GL, Bestor TH, Bourc'his D, Hsieh CL, Tommerup N, et al. Chromosome instability and immunodeficiency syndrome caused by mutations in a DNA methyltransferase gene. Nature. 1999;402:187–191. - PubMed
    1. DeBaun MR, Niemitz EL, McNeil DE, Brandenburg SA, Lee MP, et al. Epigenetic alterations of H19 and LIT1 distinguish patients with Beckwith-Wiedemann syndrome with cancer and birth defects. Am J Hum Genet. 2002;70:604–611. - PMC - PubMed

Publication types