. 2009 Aug;5(8):e1000604.
doi: 10.1371/journal.pgen.1000604. Epub 2009 Aug 14.

Nuclear calcium signaling controls expression of a large gene pool: identification of a gene program for acquired neuroprotection induced by synaptic activity

Affiliations

Nuclear calcium signaling controls expression of a large gene pool: identification of a gene program for acquired neuroprotection induced by synaptic activity

Sheng-Jia Zhang et al. PLoS Genet. 2009 Aug.

Abstract

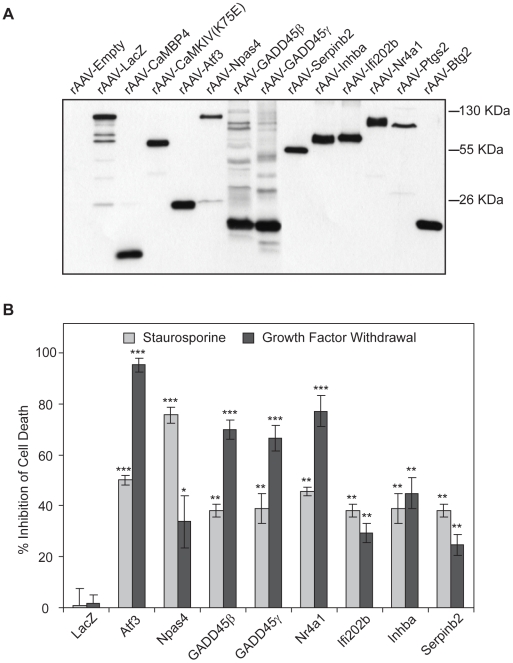
Synaptic activity can boost neuroprotection through a mechanism that requires synapse-to-nucleus communication and calcium signals in the cell nucleus. Here we show that in hippocampal neurons nuclear calcium is one of the most potent signals in neuronal gene expression. The induction or repression of 185 neuronal activity-regulated genes is dependent upon nuclear calcium signaling. The nuclear calcium-regulated gene pool contains a genomic program that mediates synaptic activity-induced, acquired neuroprotection. The core set of neuroprotective genes consists of 9 principal components, termed Activity-regulated Inhibitor of Death (AID) genes, and includes Atf3, Btg2, GADD45beta, GADD45gamma, Inhibin beta-A, Interferon activated gene 202B, Npas4, Nr4a1, and Serpinb2, which strongly promote survival of cultured hippocampal neurons. Several AID genes provide neuroprotection through a common process that renders mitochondria more resistant to cellular stress and toxic insults. Stereotaxic delivery of AID gene-expressing recombinant adeno-associated viruses to the hippocampus confers protection in vivo against seizure-induced brain damage. Thus, treatments that enhance nuclear calcium signaling or supplement AID genes represent novel therapies to combat neurodegenerative conditions and neuronal cell loss caused by synaptic dysfunction, which may be accompanied by a deregulation of calcium signal initiation and/or propagation to the cell nucleus.


Conflict of interest statement

The authors have declared that no competing interests exist.

Figures

Figure 1
Figure 1. Color-coded map of genes regulated by neuronal activity and nuclear calcium signaling and their molecular functions.
Each box corresponds to one gene whose position within the two maps is identical; corresponding positions on the map indicate the regulation of a given gene by AP bursting and nuclear calcium signaling. (A) The maximum fold change in expression (induction or repression) based on Affymetrix microarray analysis at 4 hours after the on-set of action potential (AP) bursting is color-coded as indicated. Genes are sorted on the basis of their induction/repression values in a “descending” order, i.e. from the highest levels of induction following AP bursting at the top (indicated in dark red color) to the highest level of repression following AP bursting at the bottom (indicated in dark green color). (B) Genes whose induction or repression by AP bursting is inhibited by expression of CaMBP4 are highlighted in blue; more than 80% inhibition (dark blue), between 60 and 80% inhibition (light blue), between 40 and 60% inhibition (very light blue). White boxes indicate genes whose induction or repression by AP bursting is inhibited less than 40% by expression of CaMBP4. The complete list of all blue-indicated genes is given in Table 1. (C) Molecular functions of the 185 nuclear calcium-regulated genes based on Gene Ontology information provided by Affymetrix (http://www.affymetrix.com).
Figure 2
Figure 2. Nuclear calcium signaling controls activity-dependent regulation of AID genes.
Affymetrix GeneChip profiles and QRT-PCR analysis of the indicated AID genes and Ptgs2 are shown. Uninfected hippocampal neurons or hippocampal neurons infected with rAAV-LacZ, rAAV-CaMBP4, or rAAV-CaMKIVK75E were left unstimulated or were stimulated for 4 hours with 50 µM bicuculline (to induce AP bursting). Total RNA extracted from hippocampal neurons was used for GeneChip expression profiling and QRT–PCR analysis. Bars represent means±SEM (GeneChip, n = 3; QRT–PCR, n = 4). Statistical analysis of the inhibition of the AP bursting-induced increase in mRNA expression, assessed using QRT-PCR, by CaMBP4 or CaMKIVK75E relative to rAAV-LacZ control was determined by analysis of variance (ANOVA); *p<0.05; **p<0.01; ***p<0.001. The significance of the AP bursting-induced increase in expression (compared to unstimulated control), assessed using QRT–PCR, in uninfected hippocampal neurons and in hippocampal neurons infected with rAAV-LacZ was p<0.001 for each gene shown.
Figure 3
Figure 3. AID genes promote neuronal survival in vitro.
(A) Immunoblot analysis of viral vector mediated genes expression in hippocampal neurons. Hippocampal neurons were infected with rAAV-Empty, rAAV-LacZ, rAAV-CaMBP4, rAAV-CaMKIVK75E, rAAV-Npas4, rAAV-Nr4a1, rAAV-Atf3, rAAV-Ifi202b, rAAV-GADD45β, rAAV-GADD45γ, rAAV-Inhba, rAAV-Serpinb2, rAAV-Ptgs2, or rAAV-Btg2 and Flag-tagged proteins were detected with anti-Flag antibodies. (B) Analysis of cell death induced by growth factor withdrawal or staurosporine treatment in hippocampal neurons infected with rAAVs expressing Atf3, GADD45β, GADD45γ, Ifi202b, Inhibin β-A, LacZ, Npas4, Nr4a1, and Serpinb2. The growth factor withdrawal- and staurosporine-induced increase in dead cells in infected neurons relative to the growth factor withdrawal- and staurosporine-induced increase in dead cells in uninfected neurons was calculated; the effects of viral vector-mediated expression of the indicated genes is shown as percentage inhibition of cell death relative to uninfected control. Bars represent means±SEM (n = 3). Statistical analysis was determined by analysis of variance (ANOVA); **p<0.01; ***p<0.001.
Figure 4
Figure 4. AID genes are necessary for activity-dependent neuronal survival.
(A) QRT–PCR analyses illustrating the blockade of activity-dependent induction of Npas4, Atf3, GADD45β and GADD45γ using RNAi. Uninfected hippocampal neurons or hippocampal neurons infected with rAAVs expressing either a control shRNA (rAAV-Control-RNAi) or shRNAs that target Atf3 (rAAV-Atf3-RNAi), GADD45β (rAAV-GADD45β-RNAi), GADD45γ (rAAV-GADD45γ-RNAi), or Npas4 (rAAV-Npas4-RNAi) were stimulated for 4 hours with 50 µM bicuculline to induce AP bursting or were left unstimulated. Bars represent means±SEM (n = 3). Statistical analysis was determined by analysis of variance (ANOVA); ***p<0.001. For each gene shown, the significance for the AP bursting-induced increase in expression (compared to unstimulated control), in uninfected hippocampal neurons and in hippocampal neurons infected with rAAV-Control-RNAi was p<0.001 (ANOVA). (B,C) Analysis of the role of Atf3, GADD45β, GADD45γ and Npas4 in activity-dependent neuronal survival. Uninfected hippocampal neurons or hippocampal neurons infected with rAAV-Control-RNAi, rAAV-Atf3-RNAi, rAAV-GADD4β-RNAi, rAAV-GADD45γ-RNAi and rAAV-Npas4-RNAi were left untreated or were treated for 16 hours with bicuculline (50 µM) in the presence of 4-AP (250 µM) to induce activity-dependent neuronal survival. Subsequently, apoptosis induced by staurosporine treatment (B) or growth factor withdrawal (-GF) (C) was analyzed. Expression of rAAV-Atf3-RNAi, rAAV-GADD45β-RNAi, rAAV-GADD45γ-RNAi or rAAV-Npas4-RNAi but not rAAV-Control-RNAi reduced neuroprotection afforded by synaptic activity. Bars represent means±SEM (B, n = 3; C, n = 3). Statistical analysis was determined by analysis of variance (ANOVA); ***p<0.001; N.S, not significant. The infection rates ranged from 85 to 95 percent of the neurons; they were determined immunocytochemically using antibodies to hrGFP or by analyzing the fluorescence of hrGFP. In both types of cell death assays, the basal cell death rates in hippocampal neurons expressing shRNAs specific for Atf3, Npas4, GADD4β, or GADD45γ were higher than the basal death rates obtained in hippocampal neurons expressing the control shRNA; for both cell death assays, p<0.01 for Npas4, GADD45β, or GADD45γ and p<0.001 for Atf3.
Figure 5
Figure 5. Rh123 imaging of NMDA–induced break-down of mitochondrial membrane potential.
(A) Rh123 imaging of uninfected hippocampal neurons and hippocampal neurons infected with the indicated rAAVs. Neurons were stimulated with NMDA (30 µM) for 4 min followed by washout of NMDA and treatment at the indicated time with the mitochondrial uncoupler, FCCP (5 µM) to obtain the maximal Rh123 signals. Representative traces are shown; the thick line represents the mean value. (B,C) Quantitative analysis of Rh123 measurements. The NMDA-induced percent increase in Rh123 fluorescence after NMDA application is shown in (B). The area under the curve represents the integral of the Rh123 signals above baseline beginning at the time of NMDA application until the application of FCCP (C). Data represents mean±SEM (n≥4 independent experiments, with at least 100 single cells). Statistical analysis was determined by analysis of variance (ANOVA); *p<0.05; **p<0.01; ***p<0.001.
Figure 6
Figure 6. Kainate-induced neuronal cell death in control groups.
Kainate-induced cell death was assessed by Fluoro-Jade C labeling and NeuN immunoreactivity in the CA1 region of the rat hippocampus. (A) Without systemic administration of kainate to rats that have been stereotaxically injected unilaterally with PBS into the dorsal hippocampus, there was no Fluoro-Jade C staining in CA1 of the hippocampus of the ipsilateral (i.e. injected) and the contralateral (i.e. the non-injected) hemispheres. (B–E) Robust Fluoro-Jade C staining in the CA1 pyramidal cell layer was detected three days after systemic administration of kainate to rats that have been stereotaxically injected unilaterally into the dorsal hippocampus with PBS (saline, B), rAAV-Empty (C), rAAV-LacZ (D), rAAV-Ptgs2 (E) two weeks prior to kainate treatment. The ipsilateral (i.e. injected) hemispheres and the contralateral (i.e. the non-injected) hemispheres are shown. Viral vector-mediated expression of Flag-tagged Ptgs2 and LacZ was detected using antibodies to the Flag tag. Neurons were labeled using the neuronal marker NeuN. Note the reduction in NeuN staining three days after systemic administration of kainate indicating dramatic loss of neurons (compare NeuN immunoreactivity in (A) with that in (B) through (E)). Representative examples are shown from (A, n = 3; B, n = 9; C, n = 9; D, n = 12; E, n = 12). A quantitative analysis of the Fluoro-Jade C staining is given in Table 2. Scale bar is 100 µm.
Figure 7
Figure 7. AID genes provide neuroprotection in vivo.
Analysis of kainate-induced cell death in CA1 hippocampal neurons over-expressing Flag-tagged Atf3, Btg2, GADD45β, GADD45γ, Ifi202b, Inhibin β-A, Npas4, Nr4a1, and Serpinb2. Degeneration of neurons and cell loss in the CA1 region of the hippocampus was assessed using Fluoro-Jade C labeling and NeuN immunoreactivity three days after systemic administration of kainic acid to rats that have been stereotaxically injected unilaterally into the dorsal hippocampus with rAAV-Atf3, rAAV-Btg2, rAAV-GADD45β, rAAV-GADD4γ, rAAV-Ifi202b, rAAV-Inhba, rAAV-Npas4, rAAV-Nr4a1, or rAAV-Serpinb2 two weeks prior to kainate treatment. The ipsilateral (i.e. injected) hemisphere and the contralateral (i.e. the non-injected) hemisphere are shown. Viral vector-mediated expression of Flag-tagged Atf3, Btg2, GADD45β, GADD45γ, Ifi202b, Inhibin-βA, Npas4, Nr4a1, and Serpinb2 was detected using antibodies to the Flag tag. Note the decrease of Fluoro-Jade C labeling and the stronger NeuN immunoreactivity on the ipsilateral (i.e. injected) hemisphere relative to the contralateral (i.e. the non-injected) hemisphere. In case of rAAV-Ifi202b and rAAV-Serpinb2, Ifi202b and Serpinb2 were consistently expressed also in the hippocampus of the contralateral (i.e. the non-injected) hemisphere and protected neurons from kainate-induced death. Representative examples are shown (n = 12). A quantitative analysis of the Fluoro-Jade C staining is given in Table 2. Scale bar is 100 µm.

References

    1. Hardingham GE, Bading H. The Yin and Yang of NMDA receptor signalling. Trends Neurosci. 2003;26:81–89. - PubMed
    1. Hardingham GE, Fukunaga Y, Bading H. Extrasynaptic NMDARs oppose synaptic NMDARs by triggering CREB shut-off and cell death pathways. Nat Neurosci. 2002;5:405–414. - PubMed
    1. Papadia S, Stevenson P, Hardingham NR, Bading H, Hardingham GE. Nuclear Ca2+ and the cAMP response element-binding protein family mediate a late phase of activity-dependent neuroprotection. J Neurosci. 2005;25:4279–4287. - PMC - PubMed
    1. Lee B, Butcher GQ, Hoyt KR, Impey S, Obrietan K. Activity-dependent neuroprotection and cAMP response element-binding protein (CREB): kinase coupling, stimulus intensity, and temporal regulation of CREB phosphorylation at serine 133. J Neurosci. 2005;25:1137–1148. - PMC - PubMed
    1. Bok J, Wang Q, Huang J, Green SH. CaMKII and CaMKIV mediate distinct prosurvival signaling pathways in response to depolarization in neurons. Mol Cell Neurosci. 2007;36:13–26. - PMC - PubMed

Publication types