. 2009 Aug;5(8):e1000551.
doi: 10.1371/journal.ppat.1000551. Epub 2009 Aug 14.

Yersinia enterocolitica targets cells of the innate and adaptive immune system by injection of Yops in a mouse infection model

Affiliations

Yersinia enterocolitica targets cells of the innate and adaptive immune system by injection of Yops in a mouse infection model

Martin Köberle et al. PLoS Pathog. 2009 Aug.

Abstract

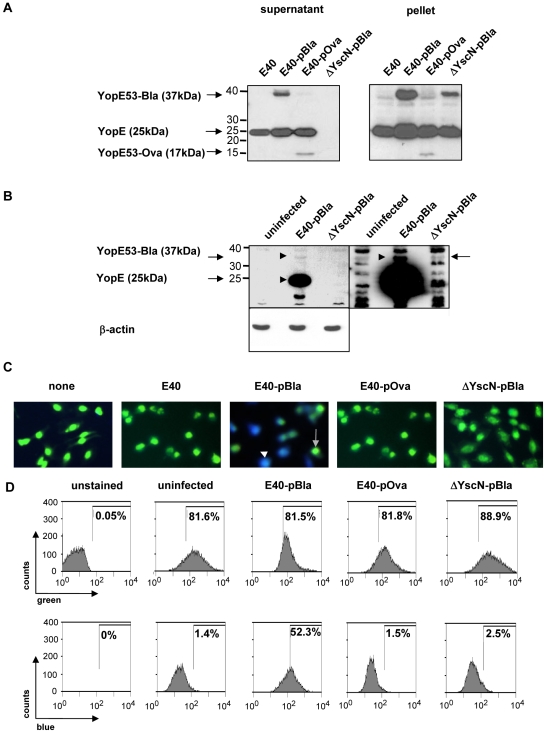
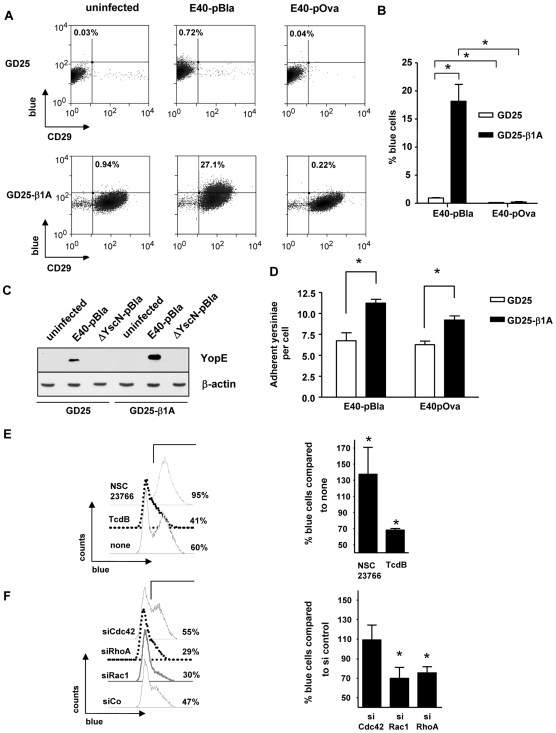
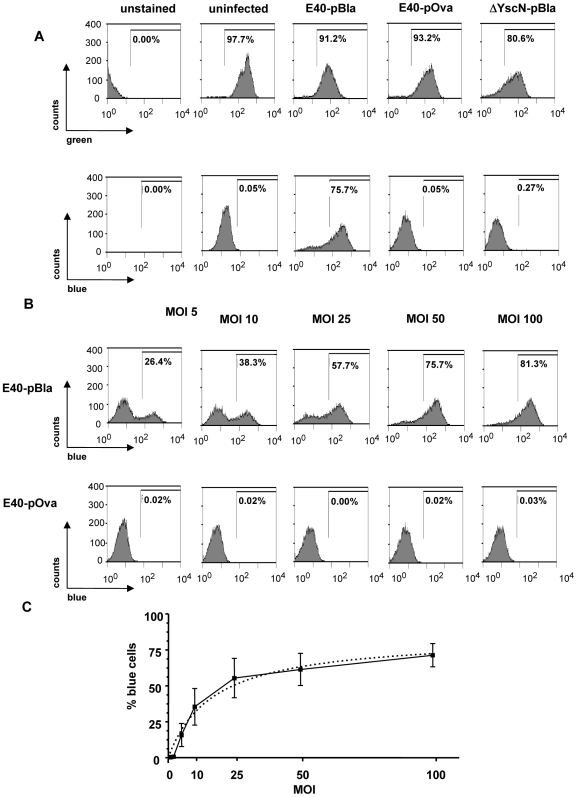
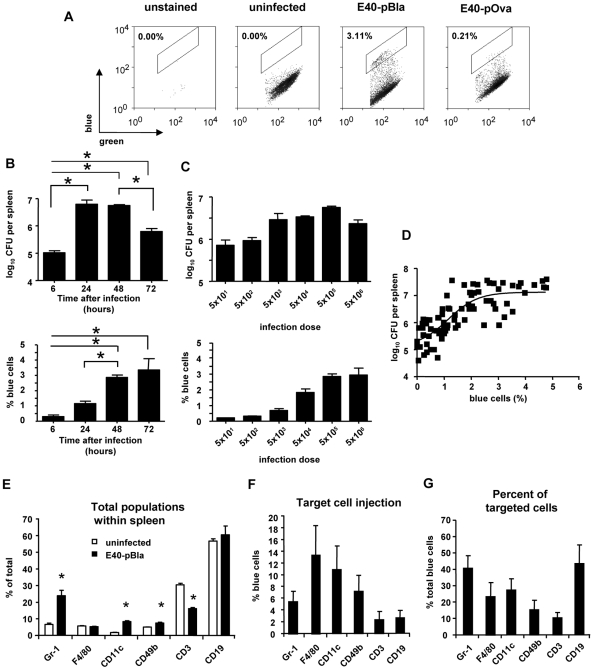
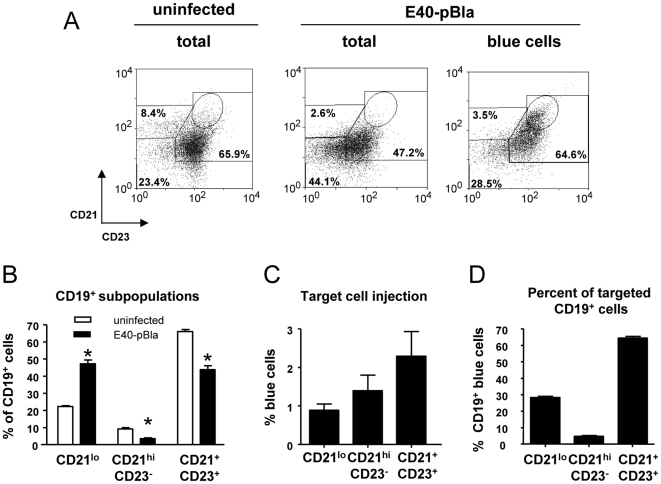
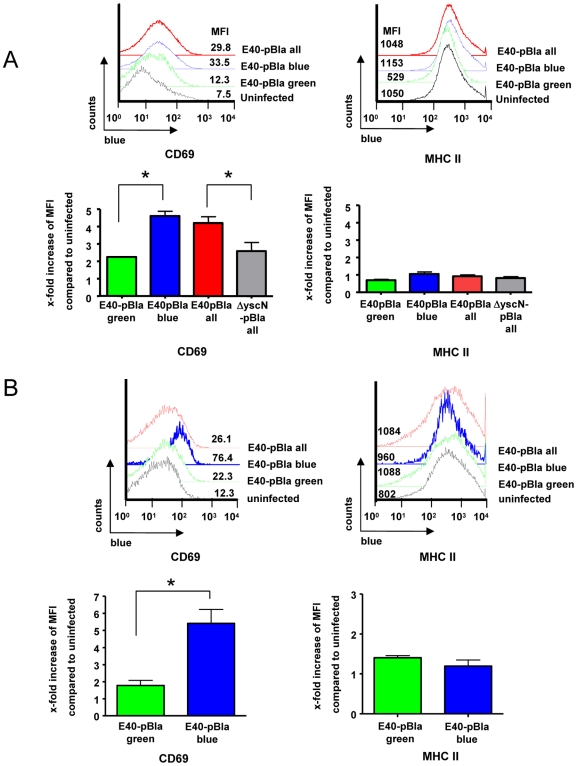
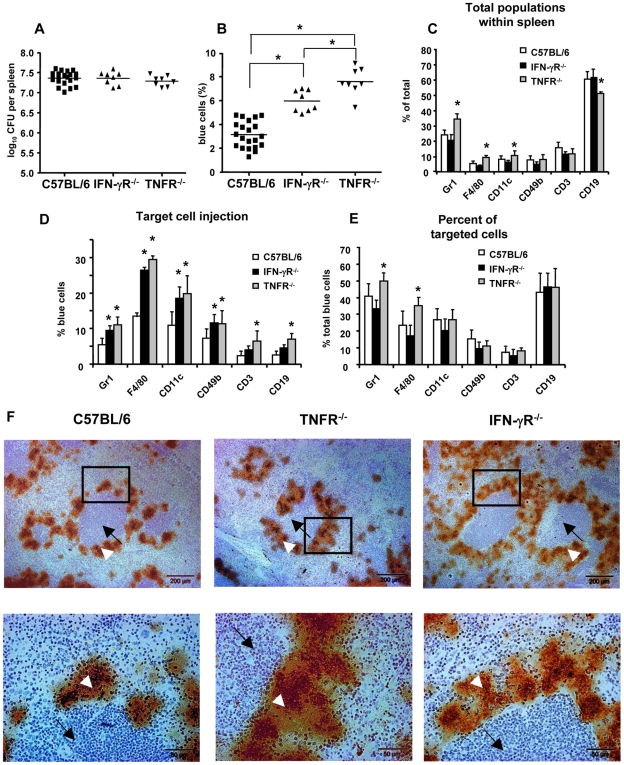
Yersinia enterocolitica (Ye) evades the immune system of the host by injection of Yersinia outer proteins (Yops) via a type three secretion system into host cells. In this study, a reporter system comprising a YopE-beta-lactamase hybrid protein and a fluorescent staining sensitive to beta-lactamase cleavage was used to track Yop injection in cell culture and in an experimental Ye mouse infection model. Experiments with GD25, GD25-beta1A, and HeLa cells demonstrated that beta1-integrins and RhoGTPases play a role for Yop injection. As demonstrated by infection of splenocyte suspensions in vitro, injection of Yops appears to occur randomly into all types of leukocytes. In contrast, upon infection of mice, Yop injection was detected in 13% of F4/80(+), 11% of CD11c(+), 7% of CD49b(+), 5% of Gr1(+) cells, 2.3% of CD19(+), and 2.6% of CD3(+) cells. Taking the different abundance of these cell types in the spleen into account, the highest total number of Yop-injected cells represents B cells, particularly CD19(+)CD21(+)CD23(+) follicular B cells, followed by neutrophils, dendritic cells, and macrophages, suggesting a distinct cellular tropism of Ye. Yop-injected B cells displayed a significantly increased expression of CD69 compared to non-Yop-injected B cells, indicating activation of these cells by Ye. Infection of IFN-gammaR (receptor)- and TNFRp55-deficient mice resulted in increased numbers of Yop-injected spleen cells for yet unknown reasons. The YopE-beta-lactamase hybrid protein reporter system provides new insights into the modulation of host cell and immune responses by Ye Yops.


Conflict of interest statement

The authors have declared that no competing interests exist.

Figures

Figure 1
Figure 1. Establishment of a β-lactamase reporter system and detection of Yop injection in HeLa cells.
(A) Secreted (left panel) and intracellular (right panel) YopE, YopE53-Bla and YopE53-Ova hybrid proteins derived from supernatants or pellets, respectively, of bacterial cultures were detected by immunoblot using anti-YopE antibodies. To determine Yop injection into HeLa cells, cells were infected for 1 h (MOI 100) and injection of YopE hybrid proteins was detected (B) by immunoblot using anti-YopE and anti-actin antibodies. To visualize YopE53-Bla exposure time was extended (right panel). (C) Yop injection was detected as blue fluorescence by staining of cells with green fluorescent TEM-1 β-lactamase sensitive FRET substrate CCF4-AM and subsequent visualization by immunofluorescence microscopy. Blue and green fluorescence recordings were overlaid to get composite pictures. Blue and green cells are indicated with white and grey arrowheads, respectively. Alternatively, fluorescence of cells was detected by (D) flow cytometry. After flow cytometry data were analyzed and depicted as histograms. The upper panel shows uptake of CCF4-AM (green) by cells. The horizontal bar indicates the gating used to determine the number of β-lactamase positive cells revealing Yop-injection (blue) in the lower panel. Representative data of one of four experiments are shown. For note: percentages of blue or green fluorescent cells found in the histograms as depicted in this or other figures represent the results of this single experiment and are therefore discrepant to the means summarizing always several experiments as described in the results section.
Figure 2
Figure 2. Role of β1-integrins for Yop injection.
GD25 and GD25-β1A cells were infected with E40-pOva or E40-pBla for one hour and subsequently stained with CCF4-AM and analyzed by flow cytometry. Living cells with high green fluorescence of CCF substrate were gated and are depicted in (A) dot blots. Data show the expression of β1-integrins (CD29) and blue fluorescence intensity of the coumarin product of uninfected or infected GD25 (upper panel) and GD25-β1A cells (lower panel) of one experiment. (B) Data show percentage of blue cells as the mean±SEM summarizing four independent experiments. Asterisks indicate significant differences (One-way ANOVA with Bonferroni corrections, p<0.001). (C) Injection of YopE into cells was detected by immunoblot using anti-YopE and anti-actin antibodies. (D) Adhesion assays were performed after infection of indicated cells with E40-pBla or E40-pOva for one hour. Bacteria and cells were stained with fuchsine and adherent bacteria per cell were counted. Data depict the mean and SD of two independent experiments. Hela cells were either (E) pretreated with TcdB (200 ng/ml) for 2 hours or pretreated with NSC23766 (100 µM) for three hours or (F) transfected with indicated siRNAs for 48 hours. Cells were subsequently infected with E40-pBla (MOI 50) for one hour and stained with CCF-AM and analyzed by flow cytometry. Data show percentage of blue cells as the mean±SEM of two (E) or three (F) independent experiments. Asterisks indicate significant differences compared to control (Paired t-test with control, p<0.05).
Figure 3
Figure 3. Detection of Yop injection in cultured splenocytes.
Figure 4
Figure 4. Distribution of Yop injection in cultured splenocytes.
Splenocytes were infected with E40-pBla (MOI 50) for 1 h. Subsequently cells were stained with CCF4-AM as well as antibodies against indicated surface markers. (A) Percentage of splenocytes expressing the indicated surface markers. (B) Percentage of blue cells of the indicated subpopulations (C) Percentage of blue cells expressing one of the indicated surface markers. Data are summarized as the mean±SD of three independent experiments.
Figure 5
Figure 5. Detection of Yop injection in splenocytes derived from infected mice.
Mice were infected with indicated Yersinia strains and isolated splenocytes were stained with CCF4-AM. In some experiments, cells were additionally stained with antibodies specific for cell surface markers (B–D). Subsequently cells were analyzed by flow cytometry. (A) Dot plots show cells gated on high levels of green fluorescence of the substrate CCF4 (viable cells) plotted versus the blue fluorescence revealing Yop-injection (infection dose 5×10⁵ for 2 days). (B) Four mice (two independent experiments with each two animals) per group were infected with 5×10⁵ E40-pBla for indicated time periods or with (C) indicated numbers of bacteria for two days and the log10 CFU in the spleen (upper panel) and the percentage of blue cells (lower panel) was determined. Data represent the mean±SD. (D) summarizes the correlation between the log10 CFU and the percentage of blue cells in the spleen of E40-pBla infected C57BL/6 mice by using data of experiments with different infection dose as well as different time ranges of infection (n  =  84). A sigmoidal regression curve was calculated (goodness of fit r2 = 0.64, sy.x  =  0.5). (E) summarizes the percentage of splenocytes expressing the indicated surface markers prior to and after infection with indicated Yersinia strains (infection dose 5×10⁵ for 2 days). Data represent the mean±SD of 5 uninfected, 5 E40-pOva or 22 E40-pBla infected mice of more than five independent experiments. (F) depicts the percentage of blue cells after infection with E40-pBla for each indicated subpopulation and (G) shows the mean±SD of the percentage of blue cells expressing one of the indicated surface markers summarizing 11 independent experiments with two mice (lowest panel), n  =  22. Comparison of all groups with each other by one-way ANOVA analysis and Bonferroni correction revealed significant differences p<0.05 in: (B) for CFU and for % blue cells: as indicated by asterisks, in (C) for CFU: 5×101 versus 5×10³ 5×10⁴, 5×10⁵ or 5×10⁶ and 5×10² versus 5×10³ , 5×10⁴ and 5×10⁵, for % blue cells: 5×101, 5×10² or 5×10³ versus 5×10⁴ , 5×10⁵, or 5×10⁶, 5×10⁴ versus 5×10⁵. Asterisks indicate differences in (E) if uninfected versus infected is compared (One-Way ANOVA with Dunnett corrections, p<0.05).
Figure 6
Figure 6. Determination of Yop injection in B cell populations.
(A) Desferrioxamine conditioned mice were mock-infected or were infected with 5×10⁵ E40-pBla for two days. Splenocytes were then stained with CD19-APC, CD21-PE-Cy7 and CD23-APC-Cy7 and with CCF-AM and then analyzed by flow cytometry. Cells were gated for viable CD19+ cells and then analyzed for expression of blue and green fluorescence as described in Figure S2. All viable CD19+ cells (total) or blue fluorescent CD19+ cells were then analyzed for CD21 and CD23 expression. CD21hiCD23 cells were defined as MZ (marginal zone B cells), CD21+CD23+ as FO (follicular B cells) and CD21 as NFB (newly formed B cells). In each diagram 10000 events are depicted. The percentage of each of these populations is indicated showing a representative experiment and percentages of the subpopulation are indicated for this experiment. (B) depicts the distribution of MZ, FO and NFB of CD19+ cells prior to and after infection of mice with E40-pBla. Asterisks indicate significant differences compared to uninfected (p<0.05) (C) Mean and SEM of the percentage of blue cells for each CD19+ subpopulation. (D) shows the mean and SEM of the distribution of each subpopulation of all blue fluorescent CD19+ cells. In total four mice per group in two independent experiments were analyzed.
Figure 7
Figure 7. Changes of CD69 expression in splenocyte populations after Yersinia infection.
(A) Cultured splenocytes were infected with E40-pBla (MOI 50) or mock-infected for 1 hour or (B) desferrioxamine conditioned C57BL/6 mice were left untreated or infected with 5×10⁵ E40-pBla for two days and the splenocytes were then isolated. Splenocytes were stained with anti-CD19-APC, anti-CD69-PE-Cy7 and subsequently with CCF4 and analyzed by flow cytometry. Cells were gated (as shown in Figure S3) for high green fluorescence (viable cells) and B cells (CD19+). Left panels show histograms for CD69 expression of non-infected cells gated for viable CD19+ cells (black line) or of E40-pBla infected cells gated for all viable CD19+ cells (total, red line), gated for green+ blue+ CD19+ cells (blue line) or green+ blue CD19+ cells (green line). Mean fluorescence intensities (MFI) of CD69 expression are depicted for this representative experiment. Right panels show the means and SEM of the x-fold increase of MFI of the indicated cells compared to uninfected of (A) three independent experiments or (B) two independent experiments with a total of five mice per group. Asterisks indicate significant differences, p<0.01.
Figure 8
Figure 8. Impact of IFN-γR and TNF-R deficiency on Yop injection.
IFN-γR−/−, TNFRp55−/− and control C57BL/6 mice were infected with E40-pBla and two days later (A) bacterial load in the spleen and (B) percentage of blue cells was determined. Each dot depicts the results for one single mouse (in total 8–22 mice were investigated). Data in (C) show the mean and SD of the distribution of cell subpopulations expressing indicated markers, in (D) the mean and SD of percentage of blue cells of each indicated subpopulation and in (E) the mean and SD of the percentage of the indicated subpopulations of blue cells. Asterisks show significant differences between all groups compared (A, B, one-way ANOVA with Bonferroni corrections, p<0.05) and differences between control mice and knockout mice (C, D, E; one-way ANOVA, with Dunnett corrections, p<0.05). F. Immunohistology of infected spleen of indicated mice. Splenic sections were stained with anti-hsp60 and counterstained with Mayer's hemalaun. White arrowheads mark lymph follicle and black arrows colonies of yersiniae. All the experiments were repeated more than four times using in total 8–22 mice. Marked regions are shown at higher magnification in lower panels.

References

    1. Smego RA, Frean J, Koornhof HJ. Yersiniosis I: microbiological and clinicoepidemiological aspects of plague and non-plague Yersinia infections. Eur J Clin Microbiol Infect Dis. 1999;18:1–15. - PubMed
    1. Koornhof HJ, Smego RA, Jr, Nicol M. Yersiniosis. II: The pathogenesis of Yersinia infections. Eur J Clin Microbiol Infect Dis. 1999;18:87–112. - PubMed
    1. Cornelis GR. Yersinia type III secretion: send in the effectors. J Cell Biol. 2002;158:401–408. - PMC - PubMed
    1. Hueck CJ. Type III protein secretion systems in bacterial pathogens of animals and plants. Microbiol Mol Biol Rev. 1998;62:379–433. - PMC - PubMed
    1. Cornelis GR. The type III secretion injectisome. Nat Rev Microbiol. 2006;4:811–825. - PubMed

Publication types

MeSH terms

Substances