. 2009 Aug 4:3:10.
doi: 10.3389/neuro.10.010.2009. eCollection 2009.

A model for cortical rewiring following deafferentation and focal stroke

Affiliations

A model for cortical rewiring following deafferentation and focal stroke

Markus Butz et al. Front Comput Neurosci. .

Abstract

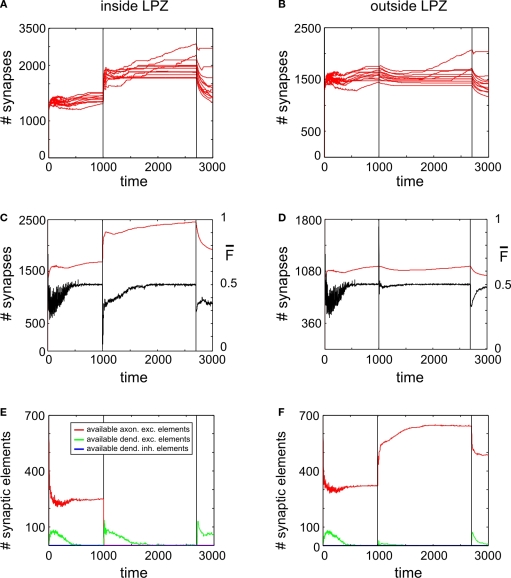
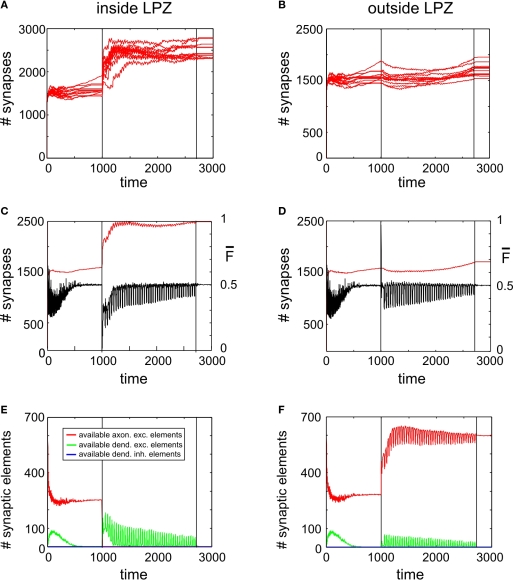
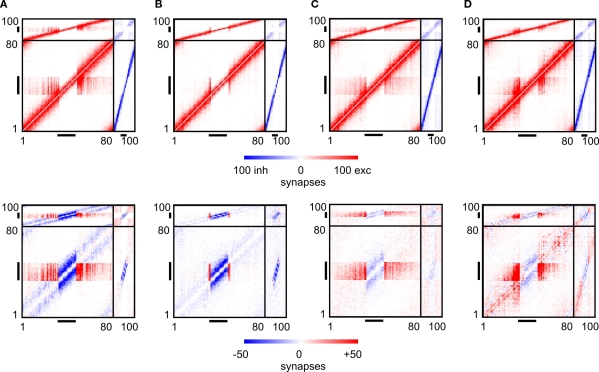
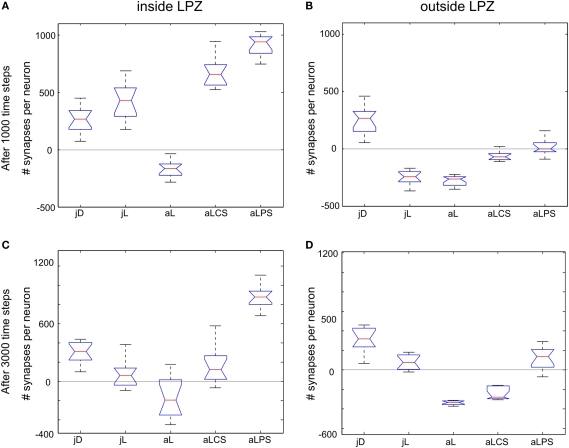
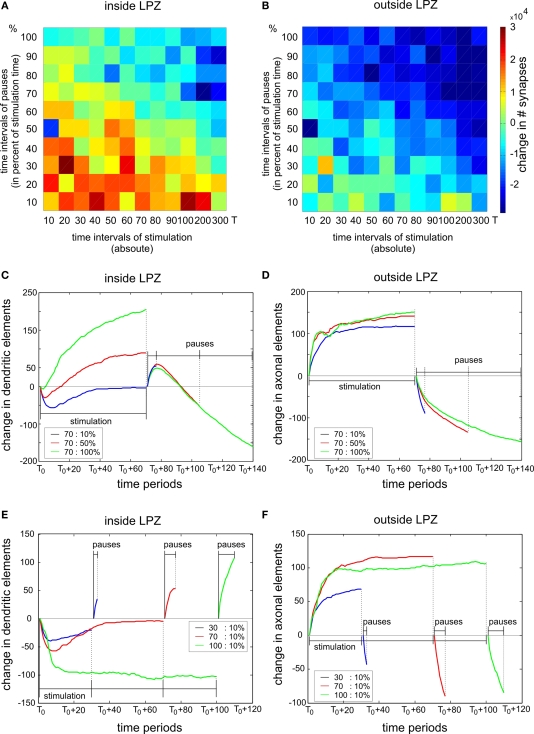
It is still unclear to what extent structural plasticity in terms of synaptic rewiring is the cause for cortical remapping after a lesion. Recent two-photon laser imaging studies demonstrate that synaptic rewiring is persistent in the adult brain and is dramatically increased following brain lesions or after a loss of sensory input (cortical deafferentation). We use a recurrent neural network model to study the time course of synaptic rewiring following a peripheral lesion. For this, we represent axonal and dendritic elements of cortical neurons to model synapse formation, pruning and synaptic rewiring. Neurons increase and decrease the number of axonal and dendritic elements in an activity-dependent fashion in order to maintain their activity in a homeostatic equilibrium. In this study we demonstrate that synaptic rewiring contributes to neuronal homeostasis during normal development as well as following lesions. We show that networks in homeostasis, which can therefore be considered as adult networks, are much less able to compensate for a loss of input. Interestingly, we found that paused stimulation of the networks are much more effective promoting reorganization than continuous stimulation. This can be explained as neurons quickly adapt to this stimulation whereas pauses prevents a saturation of the positive stimulation effect. These findings may suggest strategies for improving therapies in neurologic rehabilitation.

Keywords: axonal sprouting; cortical remapping; homeostasis; lesion-induced plasticity; neurological rehabilitation; neuronal network model; structural plasticity; synaptogenesis.


Figures

Figure 1
Figure 1
Age-dependent recovery. Here, the ‘recovery’ time, until all neurons are in a homeostatic regime again, is shown for different onsets of the lesion from 1 (1T) to 1000 morphogenetic time steps (1000T). Different sizes of the lesion (3, 11, 15, 17, 21, 25 and 31 neurons) were tested for the impact of the lesion size on the recovery time. Lesions larger than 15 neurons show an exponential increase in recovery time for later onsets. Stable networks do not completely compensate for lesions of that size within the maximum simulation time of 5000 morphogenetic time steps. Lesions equal or larger than 31 neurons are not fully compensated spontaneously independent of when the lesion sets in.
Figure 2
Figure 2
Juvenile development. The three panels (A–C) show the network connectivity before (A) and after reorganization (C) as well as the absolute change in connectivity (B). The colour coding of each square (see colour bars below panels) indicates the number of binary synapses from neuron j (column) to neuron i (row) (A,C) or the change in synapses numbers (B), respectively. (D) Shows the time course of excitatory synapse numbers per neuron for 12 individual simulations. (E) Shows the course of mean firing probability (black curve) and mean (excitatory) synapse numbers (red curve) averaged over the simulations in (D). (F) Shows the mean amount of vacant synaptic elements over time averaged over the simulations in (D).
Figure 3
Figure 3
Juvenile lesion. A subset of 21 neurons (16 excitatory and 5 inhibitory) lost their input at time step 20 (vertical line). Left column summarizes changes for subsets of the excitatory neurons that lost input (neurons within the LPZ) whereas the right column shows the same for excitatory neurons outside the LPZ. (A,B) Course of excitatory synapse numbers per neuron over time from 12 individual simulations. (C,D) Course of mean firing probability (black curve) and mean excitatory synapse numbers (red curve) averaged over simulations in (A,B). In all simulations, neurons reach homeostasis after the lesion again spontaneously. (E,F) Gives the development of synaptic elements over time averaged over the simulations in (A,B).
Figure 4
Figure 4
Adult lesion. A subset of 16 excitatory (and 5 inhibitory) neurons lost their input at time step 1000 (vertical line) when network connectivity is stable (‘adult networks’). Left column again summarizes changes within the LPZ whereas the right column shows the same for neurons outside the LPZ. (A,B) Course of excitatory synapse numbers per neuron over time from 12 individual simulations. (C,D) Course of mean firing probability (black curve) and mean excitatory synapse numbers (red curve) averaged over simulations in (A,B). There is an overall loss in synapses numbers in the LPZ as well as in intact regions. Thus, neurons which lost their input will not reach homeostasis after the lesion again. However, neurons that kept their input are able to regain homeostasis. (E,F) Gives the development of synaptic elements over time averaged over the simulations in (A,B). Within the lesion projection zone there is a lack of vacant axonal elements but a high demand of synaptic input expressed by an increased number of vacant excitatory dendritic elements. Neurons outside the lesion projection zone respond with moderate axonal sprouting.
Figure 5
Figure 5
Adult lesion with continuous stimulation. Simulations in this figure use the same settings as in Figure 4. In addition, neurons outside the LPZ are continuously stimulated with a strong excitatory input beginning with the onset of the lesion at T = 1000 and lasting until T = 2700. Thereafter, neurons only receive the standard random input. Onset of lesion and stimulation as well as the turn off of stimulation is indicated by vertical lines. (A,B) Course of excitatory synapse numbers per neuron over time from 12 individual simulations. (C,D) Course of mean firing probability (black curve) and mean excitatory synapse numbers (red curve) averaged over simulations in (A,B). (E,F) Gives the development of synaptic elements over time averaged over the simulations in (A,B).
Figure 6
Figure 6
Adult lesion with paused stimulation. Simulations in this figure use the same settings as in Figure 5 but here stimulations are interrupted by short pauses. (A,B) Course of excitatory synapse numbers per neuron over time from 12 individual simulations. (C,D) Course of mean firing probability (black curve) and mean synapse numbers (red curve) averaged over simulations in (A,B). (E,F) Gives the development of synaptic elements over time averaged over the simulations in (A,B). Vertical lines in all panels indicate the onset of the lesion at the same time with the beginning of the paused stimulation at T = 1000 and the final turn off of the stimulation at T = 2700.
Figure 7
Figure 7
Changes in connectivity. The first row of panels shows the final connectivity at the end of each simulation (T = 3000). The second row shows the differences between connectivity before the lesion and at T = 3000. In accordance to Figure 1, red colours indicate numbers of excitatory synapses (first row) or an increase in synapses (second row), respectively. Blue colours specify inhibitory synapses or a decrease in synapses, respectively. Black horizontal bars indicate output synapses arising from neurons inside the LPZ. Black vertical bars indicate input synapses hosted by neurons inside the LPZ. (A) Final connectivity and change in connectivity after a juvenile lesion. (B) Final connectivity and change in connectivity after an adult lesion. (C) Final connectivity and change in connectivity after an adult lesion with a continuous stimulation. (D) Final connectivity and change in connectivity after an adult lesion with a paused stimulation.
Figure 8
Figure 8
Group differences. Changes in excitatory synapse numbers per neuron between different stimulation protocols at 1000 (first row; A,B) and 3000 morphogenetic time steps after the lesion (second row; C,D). The figure shows the changes in excitatory synapses inside (left column; A,C) and outside the lesion projection zone (right column; B,D) and its distribution over the 12 data sets used (as shown in Figures 2A,B to 6A,B) as well as the 95 percentile for each group (jD, juvenile development; jL, juvenile lesion; aL, adult lesion; aLCS, adult lesion with continuous stimulation; aLPS, adult lesion with paused stimulation).
Figure 9
Figure 9
Trade-off between stimulation and pause times. The left column shows changes inside the LPZ whereas the right column shows changes outside the LPZ. (A, B) Total difference in excitatory synapses between onset of lesion and final connectivity state for different stimulation and pause times. The chosen stimulation times are specified as morphogenetic time steps (x-axis) whereas the chosen pause times are given as percentage values of the stimulation time in 10% increments (y-axis). For example, 100% of pause time means that the pause phase is as long as the stimulation phase. In (C–F) the x-axis gives the time period of each stimulation and pause phase starting at T0. Each curve indicates the mean changes in dendritic and axonal elements during stimulations and pauses for different exemplary combinations of stimulation and pause times. In (C) and (D) we show the impact of varying pause lengths (blue: 10%, red: 50% and green: 100% of stimulation time) whereas in (E) and (F) we show the impact of different stimulation times (blue: 30, red: 70 and green: 100 morphogenetic time steps). Dashed vertical lines mark the ending of the stimulation and pause phases, respectively.

Similar articles

Cited by

References

    1. Arellano J. I., Espinosa A., Fairen A, Yuste R., DeFelipe J. (2007). Non-synaptic dendritic spines in neocortex. Neuroscience 145, 464–46910.1016/j.neuroscience.2006.12.015 - DOI - PubMed
    1. Bangert M., Altenmüller E. O. (2003). Mapping perception to action in piano practice: a longitudinal DC-EEG study. BMC Neurosci 4, 26.10.1186/1471-2202-4-26 - DOI - PMC - PubMed
    1. Butz M., Lehmann K., Dammasch I. E., Teuchert-Noodt G. (2006). A theoretical network model to analyse neurogenesis and synaptogenesis in the dentate gyrus. Neural Netw. 19, 1490–150510.1016/j.neunet.2006.07.007 - DOI - PubMed
    1. Butz M., Teuchert-Noodt G. (2006). A simulation model for compensatory plasticity in the prefrontal cortex inducing a cortico-cortical dysconnection in early brain development. J. Neural Transm. 113, 695–71010.1007/s00702-005-0403-4 - DOI - PubMed
    1. Butz M., Teuchert-Noodt G., Grafen K., van Ooyen A. (2008). Inverse relationship between adult hippocampal cell proliferation and synaptic rewiring in the dentate gyrus. Hippocampus 18, 879–89810.1002/hipo.20445. - DOI - PubMed

LinkOut - more resources