. 2009 Aug;5(8):e1000605.
doi: 10.1371/journal.pgen.1000605. Epub 2009 Aug 14.

CHD3 proteins and polycomb group proteins antagonistically determine cell identity in Arabidopsis

Affiliations

CHD3 proteins and polycomb group proteins antagonistically determine cell identity in Arabidopsis

Ernst Aichinger et al. PLoS Genet. 2009 Aug.

Abstract

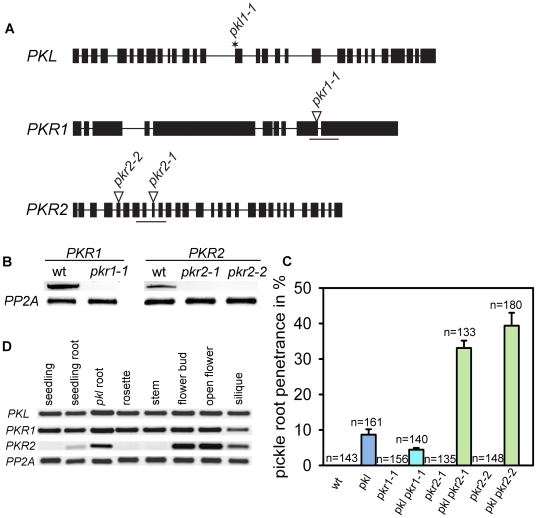
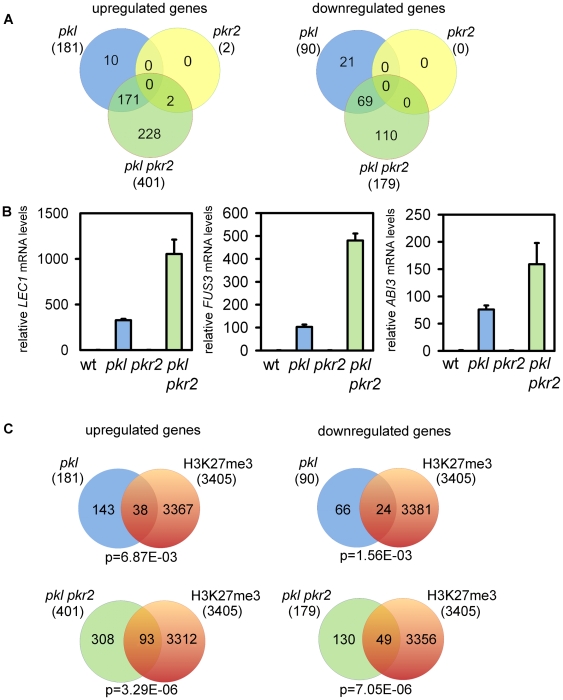
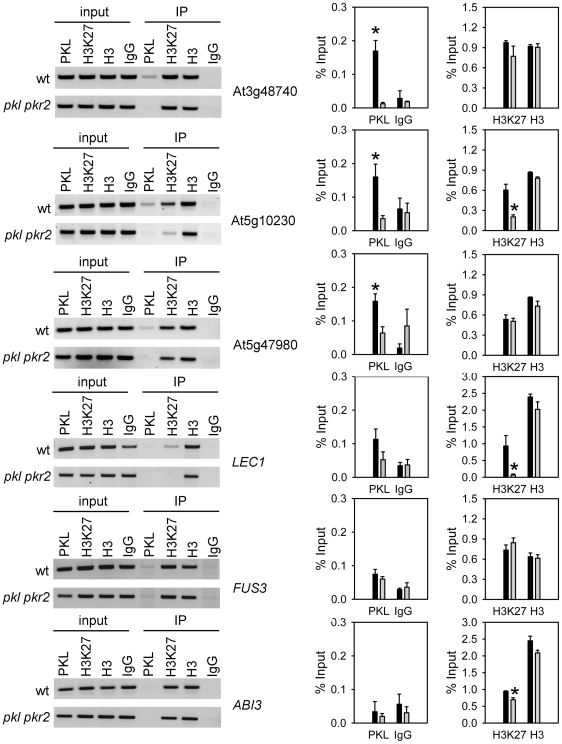
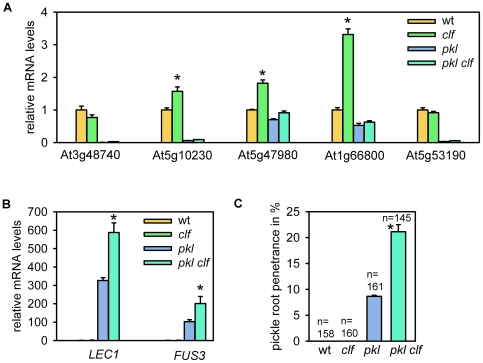
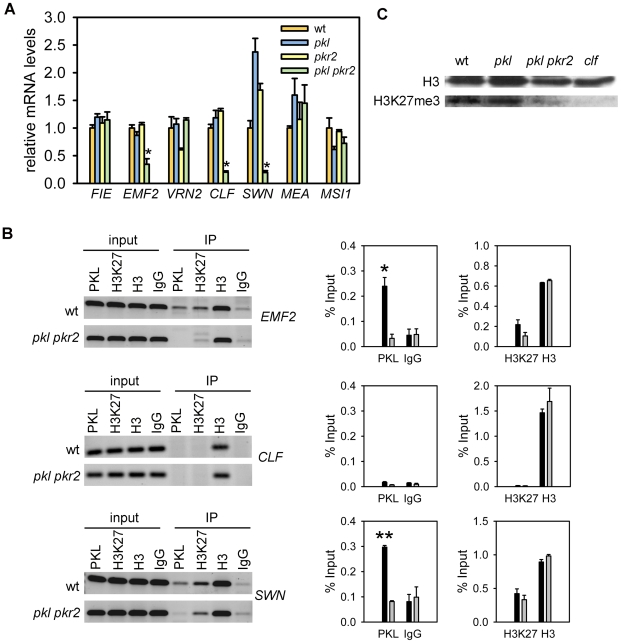
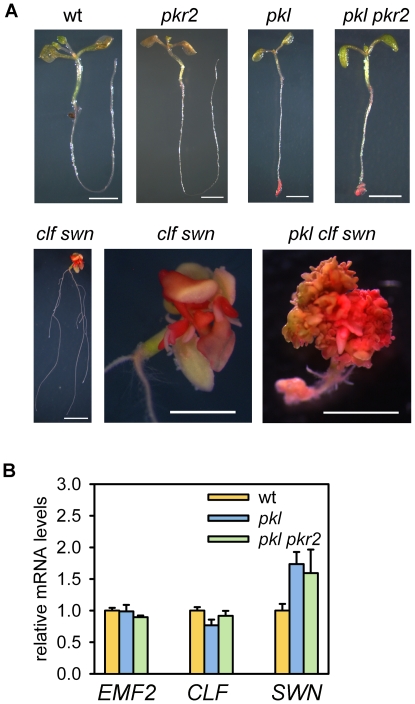
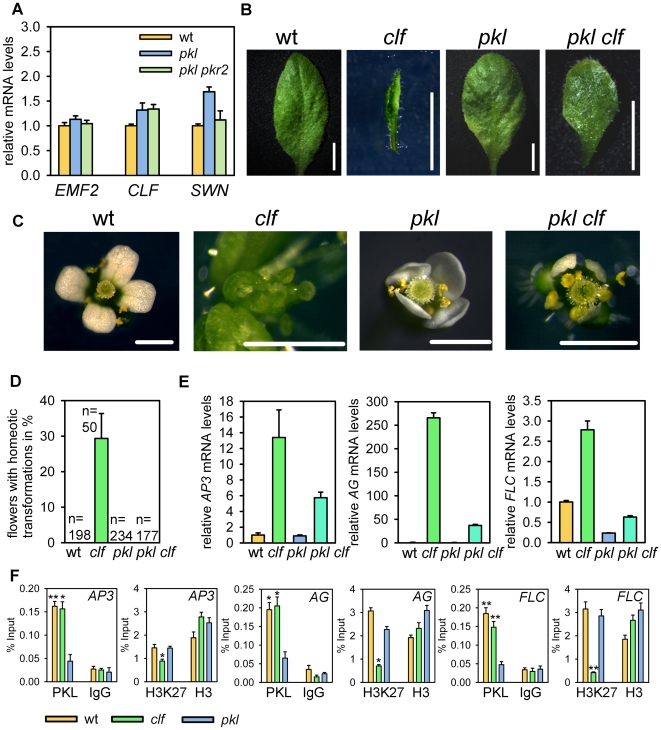
Dynamic regulation of chromatin structure is of fundamental importance for modulating genomic activities in higher eukaryotes. The opposing activities of Polycomb group (PcG) and trithorax group (trxG) proteins are part of a chromatin-based cellular memory system ensuring the correct expression of specific transcriptional programs at defined developmental stages. The default silencing activity of PcG proteins is counteracted by trxG proteins that activate PcG target genes and prevent PcG mediated silencing activities. Therefore, the timely expression and regulation of PcG proteins and counteracting trxG proteins is likely to be of fundamental importance for establishing cell identity. Here, we report that the chromodomain/helicase/DNA-binding domain CHD3 proteins PICKLE (PKL) and PICKLE RELATED2 (PKR2) have trxG-like functions in plants and are required for the expression of many genes that are repressed by PcG proteins. The pkl mutant could partly suppress the leaf and flower phenotype of the PcG mutant curly leaf, supporting the idea that CHD3 proteins and PcG proteins antagonistically determine cell identity in plants. The direct targets of PKL in roots include the PcG genes SWINGER and EMBRYONIC FLOWER2 that encode subunits of Polycomb repressive complexes responsible for trimethylating histone H3 at lysine 27 (H3K27me3). Similar to mutants lacking PcG proteins, lack of PKL and PKR2 caused reduced H3K27me3 levels and, therefore, increased expression of a set of PcG protein target genes in roots. Thus, PKL and PKR2 are directly required for activation of PcG protein target genes and in roots are also indirectly required for repression of PcG protein target genes. Reduced PcG protein activity can lead to cell de-differentiation and callus-like tissue formation in pkl pkr2 mutants. Thus, in contrast to mammals, where PcG proteins are required to maintain pluripotency and to prevent cell differentiation, in plants PcG proteins are required to promote cell differentiation by suppressing embryonic development.


Conflict of interest statement

The authors have declared that no competing interests exist.

Figures

Figure 1
Figure 1. PKL and PKR2 act redundantly to maintain root cell identity.
(A) Genomic organization of the PKL, PKR1 and PKR2 loci. The pkl-1 mutation (asterisk) is a described EMS allele cit_bf cit_af ref_bf(Li, 2005 ref_num5603)ref_af. T-DNAs (black triangles) are inserted in the 9th exon in the pkr1-1 and in the 9th and 5th exons in pkr2-1 and pkr2-2 mutants, respectively. Black boxes represent exons, connecting lines introns. Analyzed regions tested by RT-PCR are marked by a line below the genomic loci. (B) Transcript accumulation in wild-type pkr1-1, pkr2-1, and pkr2-2 flower buds was tested by RT-PCR. (C) pickle root formation was assayed in five-day-old wild-type, pkl, pkr1-1, pkl pkr1-1, pkr2-1, pkl pkr2-1, pkr2-2, and pkl pkr2-2 seedling roots. Numbers on top of bars represent total number of scored seedlings. Experiments were performed in triplicates. Error bars, SEM. (D) RT–PCR analysis of PKL, PKR1 and PKR2 in different plant tissues. wt, wild-type.
Figure 2
Figure 2. pkr2 synergistically increases deregulated genes in pkl and deregulated genes are marked by H3K27me3.
(A)Venn diagrams of up-regulated and down-regulated genes in pkl, pkr2, and pkl pkr2 roots. Numbers in parenthesis represent total numbers of up-regulated and down-regulated genes in the respective genotypes. (B) Quantitative RT-PCR analysis of LEC1, FUS3 and ABI3 expression in roots of wild-type, pkl, pkr2 and pkl pkr2 five-day-old seedlings. Error bars, SEM. (C) Venn diagrams of up-regulated and down-regulated genes in pkl and pkl pkr2 and genes marked by H3K27me3 . p-values are based on the hypergeometric test. wt, wild-type.
Figure 3
Figure 3. PKL directly binds to genes with reduced expression in pkl mutants.
ChIP analysis of PKL binding, H3K27me3 and H3 levels at At3g48740, At5g10230, At5g47980, LEC1, FUS3, and ABI3 in five-day-old seedling roots. Nonspecific IgG antibodies served as a negative control. ChIP PCR was performed in triplicate, one representative PCR for each locus is shown in the left panels, and quantification of the results show recovery as percent of input in the right panels. Black and gray bars represent wild type and pkl pkr2, respectively. Significance of PKL binding (left panels) and reduced H3K27me3 in pkl pkr2 (right panels) was determined by two-tailed Student's t-test, *P<0.01. Error bars, SEM. IP, immunoprecipitation.
Figure 4
Figure 4. Direct PKL target genes have similar expression levels in pkl and pkl clf double mutants, while LEC1 and FUS3 are synergistically up-regulated in pkl clf.
Quantitative RT–PCR analysis of (A) At3g48740, At5g10230, At5g47980, At1g66800, At5g53190 and (B) LEC1 and FUS3 expression in roots of five-day-old wild-type, clf, pkl, and pkl clf seedlings. Significance of increased mRNA levels compared to wild-type (A) and pkl (B) was determined by two-tailed Student's t-test, *P<0.001. Error bars, SEM. (C) pickle root formation was assayed from five-day-old wild-type, clf, pkl, and pkl clf seedling roots. Numbers on top of bars represent total number of scored seedlings. Experiments were performed in triplicates. Significance of increased pickle root penetrance in pkl clf compared to pkl was determined by two-tailed Student's t-test, *P<0.01. Error bars, SEM. wt, wild-type.
Figure 5
Figure 5. Reduced H3K27me3 levels in pkl pkr2 are associated with reduced expression levels of direct PKL target genes EMF2 and SWN.
(A) Quantitative RT–PCR analysis of FIE, EMF2, VRN2, CLF, SWN, MEA and MSI1 expression in roots of wild-type, pkl, pkr2, and pkl pkr2 seedlings. Significance of decreased mRNA levels compared to wild-type was determined by two-tailed Student's t-test, *P<0.001. Error bars, SEM. (B) ChIP analysis of PKL binding, H3K27me3 and H3 levels at EMF2, CLF and SWN in five-day-old seedling roots. Nonspecific IgG antibodies served as a negative control. ChIP PCR was performed in triplicate, one representative PCR for each locus is shown in the left panels, and quantification of the results show recovery as percent of input in the right panels. Black and gray bars represent wild type and pkl pkr2, respectively. Significance was determined by two-tailed Student's t-test, **P<0.001, *P<0.01. Error bars, SEM. (C) Western blot anlysis with anti-H3 and anti-H3K27me3 antibodies of wild-type, pkl, pkl pkr2 and clf seedling root tissues. wt, wild-type.
Figure 6
Figure 6. pkl enhances the clf swn phenotype.
(A) Localization of seed storage specific triacylglycerol accumulation in wild-type, pkl, pkr2, pkl pkr2, clf swn, and pkl clf swn seedlings at 14 days after germination using the lipid staining dye Fat Red. cit_bfScale bars, wt, pkl, pkr2, pkl pkr2, clf swn: 0.25 cm; clf swn close-up and pkl clf swn: 0.1 cm. (B) Quantitative RT–PCR analysis of EMF2, CLF and SWN expression in aerial parts of 14 day old wild-type, pkl and pkl pkr2 seedlings. Error bars, SEM.
Figure 7
Figure 7. pkl suppresses leaf curling and homeotic flower transformations in clf mutants.
(A) Quantitative RT–PCR analysis of EMF2, CLF and SWN expression in leaves of wild-type, pkl and pkl pkr2. Error bars, SEM. (B) Leaves of wild-type, clf, pkl, and pkl clf. Scale bars, 5 mm. (C) Flowers of wild-type, clf, pkl, and pkl clf. Scale bars, 1 mm. (D) Quantification of flowers with homeotic transformations in wild-type, clf, pkl, and pkl clf. Numbers on top of bars represent total number of scored flowers. Six individual plants were scored per genotype. Error bars, SEM. (E) Quantitative RT–PCR analysis of AG, AP3, and FLC expression in leaves of wild-type, clf, pkl, and pkl clf seedlings. Error bars, SEM. wt, wild-type. (F) ChIP analysis of PKL binding, H3K27me3 and H3 levels at AP3, AG and FLC in seedlings. Nonspecific IgG antibodies served as a negative control. Quantitative ChIP PCR was performed with four replicates and quantification of the results show recovery as percent of input. Significance was determined by two-tailed Student's t-test, **P<0.001, *P<0.01. Error bars, SEM.

References

    1. Ruthenburg AJ, Li H, Patel DJ, Allis CD. Multivalent engagement of chromatin modifications by linked binding modules. Nat Rev Mol Cell Biol. 2007;8:983–994. - PMC - PubMed
    1. Henikoff S. Nucleosome destabilization in the epigenetic regulation of gene expression. Nat Rev Genet. 2008;9:15–26. - PubMed
    1. Bleé E, Joyard J. Envelope membranes from spinach chloroplasts are a site of metabolism of fatty acid hydroperoxides. Plant Physiology. 1996;110:445–454. - PMC - PubMed
    1. Schubert D, Primavesi L, Bishopp A, Roberts G, Doonan J, et al. Silencing by plant Polycomb-group genes requires dispersed trimethylation of histone H3 at lysine 27. EMBO J. 2006;25:4638–4649. - PMC - PubMed
    1. Eshed Y, Baum SF, Bowman JL. Distinct mechanisms promote polarity establishment in carpels of Arabidopsis. Cell. 1999;99:199–209. - PubMed

Publication types

MeSH terms