. 2009 Aug;5(8):e1000590.
doi: 10.1371/journal.pgen.1000590. Epub 2009 Aug 14.

A computational screen for regulators of oxidative phosphorylation implicates SLIRP in mitochondrial RNA homeostasis

Affiliations

A computational screen for regulators of oxidative phosphorylation implicates SLIRP in mitochondrial RNA homeostasis

Joshua M Baughman et al. PLoS Genet. 2009 Aug.

Erratum in

  • PLoS Genet. 2010;6(3). doi: 10.1371/annotation/36fe7624-0904-46d4-a013-4be6195245c4

Abstract

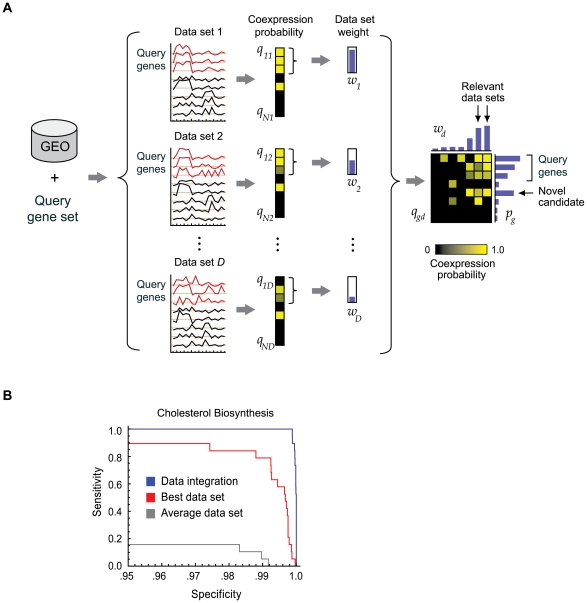
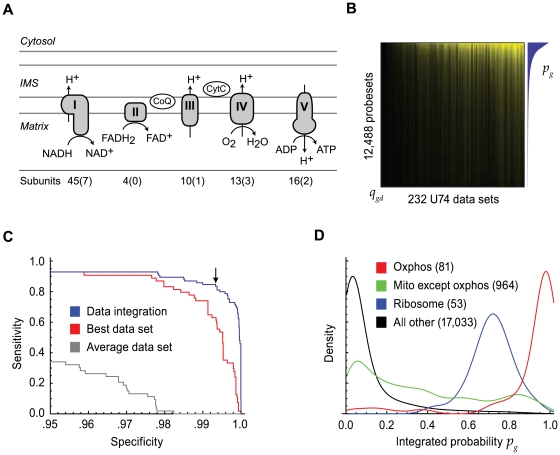
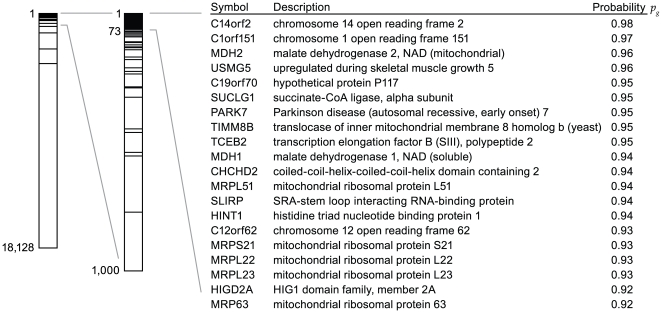
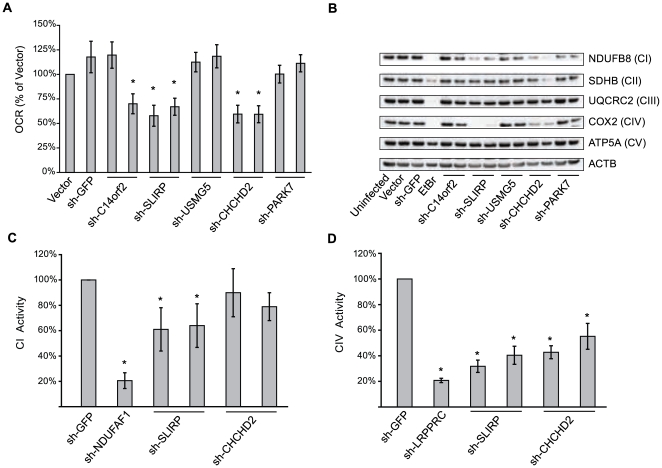
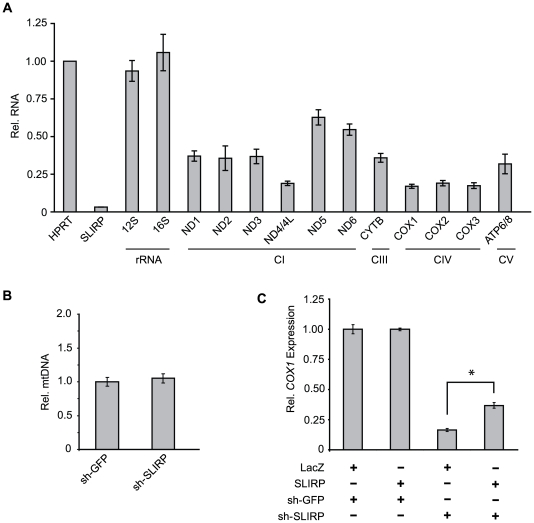
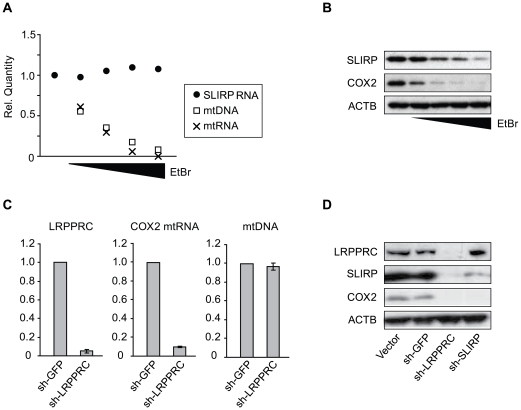
The human oxidative phosphorylation (OxPhos) system consists of approximately 90 proteins encoded by nuclear and mitochondrial genomes and serves as the primary cellular pathway for ATP biosynthesis. While the core protein machinery for OxPhos is well characterized, many of its assembly, maturation, and regulatory factors remain unknown. We exploited the tight transcriptional control of the genes encoding the core OxPhos machinery to identify novel regulators. We developed a computational procedure, which we call expression screening, which integrates information from thousands of microarray data sets in a principled manner to identify genes that are consistently co-expressed with a target pathway across biological contexts. We applied expression screening to predict dozens of novel regulators of OxPhos. For two candidate genes, CHCHD2 and SLIRP, we show that silencing with RNAi results in destabilization of OxPhos complexes and a marked loss of OxPhos enzymatic activity. Moreover, we show that SLIRP plays an essential role in maintaining mitochondrial-localized mRNA transcripts that encode OxPhos protein subunits. Our findings provide a catalogue of potential novel OxPhos regulators that advance our understanding of the coordination between nuclear and mitochondrial genomes for the regulation of cellular energy metabolism.


Conflict of interest statement

The authors have declared that no competing interests exist.

Figures

Figure 1
Figure 1. Overview and validation of expression screening.
(A) Given a set of transcriptionally regulated genes as input (query gene set), expression screening interrogates a compendium of D microarray data sets (GEO) to produce a matrix of probabilities qgd of co-expression with the query genes for each of N genes (rows) measured in D data sets (columns). Each data set is assigned a weight, wd (vertical bars), according to the intra-correlation of the query gene set. A robust Bayesian data integration procedure is used to compute an integrated probability pg of co-expression for each gene (horizontal bars). (B) Cross-validated receiver-operator curve reporting the recovery of the query cholesterol biosynthesis gene set. Blue line: full expression screen data integration (1,427 data sets). Red line: the single best data set. Gray line: a data set with median weight.
Figure 2
Figure 2. The OxPhos expression screen.
(A) A schematic overview of mitochondrial OxPhos. The total number of protein subunits comprising each complex is noted below the schematic. The number of subunits encoded by mitochondrial DNA that were excluded in the OxPhos expression screen is indicated in parentheses. (B) Co-expression matrix from the OxPhos expression screen for the mouse MG-U74Av2 chip. Each value in the matrix represents a gene's (rows) co-expression with OxPhos within a microarray data set (columns). (C) Cross-validated receiver-operator curve reporting the recovery of the query OxPhos genes. Blue line: full expression screen data integration (1,427 data sets). Arrow marks the 99.4% specificity threshold recovering 85% of the OxPhos query genes. Red line: the single best data set. Gray line: a data set with median weight. (D) Histogram of integrated co-expression probabilities from the OxPhos expression screen. Red line: OxPhos query gene set. Green line: non-oxphos mitochondrial genes. Blue line: cytosolic ribosome genes. Black line: all other genes.
Figure 3
Figure 3. Top scoring genes in the OxPhos expression screen.
Left, bar plot indicating the ranks of each OxPhos query gene by descending probability pg, as well as a magnified view of the 1,000 highest-ranking genes. The table displays the top 20 non-OxPhos genes resulting from the expression screen (corresponding to the top 73 genes including OxPhos).
Figure 4
Figure 4. Silencing CHCHD2 and SLIRP disrupts OxPhos function.
(A) Oxygen consumption rate (OCR) of MCH58 human fibroblasts measured at 10–14 days post-infection with empty vector, shRNA targeting GFP, or two independent shRNAs targeting each of five candidates from the OxPhos expression screen. Values are reported as percent of empty vector sample's OCR and represent means of 20 replicate wells. Error bars indicate the 95% normal confidence interval. (B) Western blot of cleared whole cell lysate harvested 10–14 days post-infection, subjected to SDS-Page and blotted for labile markers of each OxPhos complex. shRNA targets are indicated below each lane and blotted proteins are indicated to the right with their respective OxPhos complex in parentheses. EtBr represents a positive control sample from cells treated with 40 ng/ml ethidium bromide for 4 days. (C, D) Assays for activity of complexes I and IV in whole-cell native protein harvested from MCH58 cells infected in triplicate with shRNAs targeting SLIRP, CHCHD2 (two independent shRNAs each) or GFP. Values are reported as percent of activity for shRNA targeting GFP. Error bars represent standard deviation. *, P<0.05 (n = 3, two-tailed unpaired t-test).
Figure 5
Figure 5. SLIRP maintains mitochondrial mRNA.
(A) Expression levels of mitochondrial transcripts in MCH58 cells measured by qPCR 10 days post-infection with either control shRNA (shGFP) or shRNA targeting SLIRP. Values are reported as fold change over shGFP-treated cells, in each case normalized to HPRT as an endogenous control, and represent means (n = 3). All values except 16S and 12S were significantly decreased compared to shGFP (P<.05, two-tailed unpaired t-test). (B) mtDNA copy-number per cell measured by qPCR using genomic DNA from the samples in (A). Values represent mean mtDNA/nuclear DNA ratio (n = 3). (C) COX1 expression measured by qPCR in MCH58 cells infected with shSLIRP or shGFP. Labels LacZ and SLIRP indicate cells transfected with constructs to over-express LacZ or human SLIRP, respectively. Values reported are mean ratios over LacZ+shGFP (n = 3). Error bars indicate standard deviation. *, P<.05 (two-tailed unpaired t-test).
Figure 6
Figure 6. SLIRP depends upon mitochondrial mRNA for stability.
(A) mtDNA copy-number, mtND2 expression (mtRNA), and SLIRP expression measured by qPCR from MCH58 cells depleted of mtDNA for 4 days in the presence of 2.5, 5, 10, or 20 ng/ml ethidium bromide. (B) Western blot of SLIRP, COX2, and ACTB protein abundance for the samples in (A). (C) mtDNA copy-number and mRNA expression of COX2 and LRPPRC in MCH58 cells infected with shRNA targeting LRPPRC or a GFP control. Mean ratios over shGFP cells are reported (n = 3). (D) Western blot of protein lysates from shGFP-, shSLIRP-, and shLRPPRC-infected cells 10 days post-infection.

References

    1. DiMauro S, Schon EA. Mitochondrial respiratory-chain diseases. N Engl J Med. 2003;348:2656–2668. - PubMed
    1. Spinazzola A, Invernizzi F, Carrara F, Lamantea E, Donati A, et al. Clinical and molecular features of mitochondrial DNA depletion syndromes. J Inherit Metab Dis 2008 - PubMed
    1. Bonawitz ND, Clayton DA, Shadel GS. Initiation and beyond: multiple functions of the human mitochondrial transcription machinery. Mol Cell. 2006;24:813–825. - PubMed
    1. Fernandez-Vizarra E, Tiranti V, Zeviani M. Assembly of the oxidative phosphorylation system in humans: what we have learned by studying its defects. Biochim Biophys Acta. 2009;1793:200–211. - PubMed
    1. Thorburn DR, Sugiana C, Salemi R, Kirby DM, Worgan L, et al. Biochemical and molecular diagnosis of mitochondrial respiratory chain disorders. Biochim Biophys Acta. 2004;1659:121–128. - PubMed

Publication types