

Deregulation of hepatic insulin sensitivity induced by central lipid infusion in rats is mediated by nitric oxide
- PMID: 19680547
- PMCID: PMC2721417
- DOI: 10.1371/journal.pone.0006649
Deregulation of hepatic insulin sensitivity induced by central lipid infusion in rats is mediated by nitric oxide
Abstract
Background: Deregulation of hypothalamic fatty acid sensing lead to hepatic insulin-resistance which may partly contribute to further impairment of glucose homeostasis.
Methodology: We investigated here whether hypothalamic nitric oxide (NO) could mediate deleterious peripheral effect of central lipid overload. Thus we infused rats for 24 hours into carotid artery towards brain, either with heparinized triglyceride emulsion (Intralipid, IL) or heparinized saline (control rats).
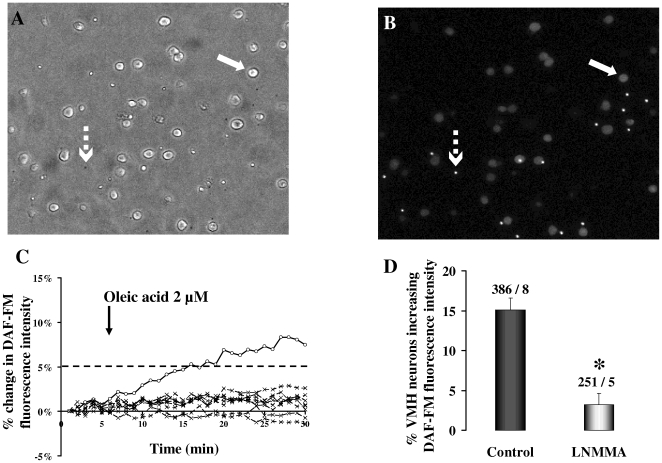
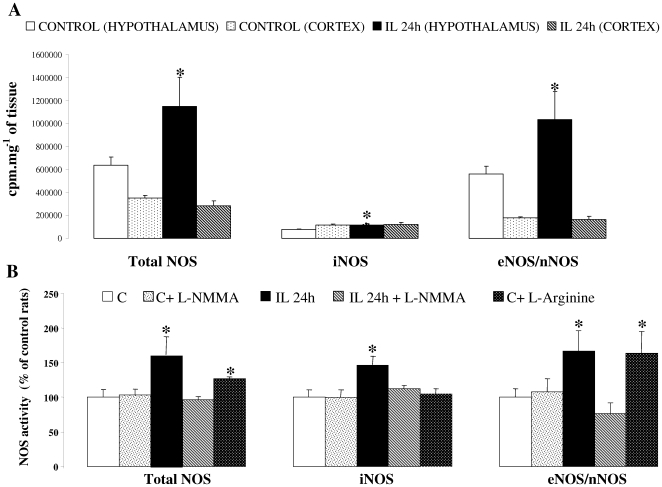
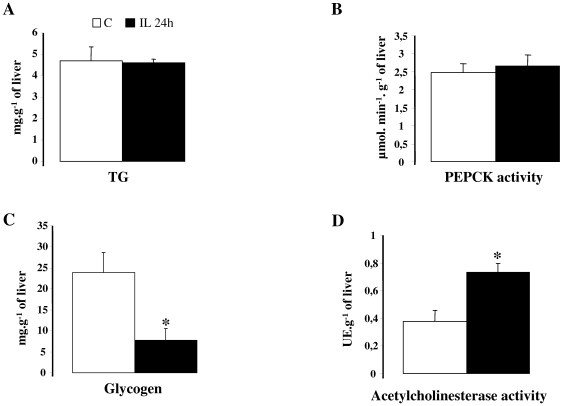
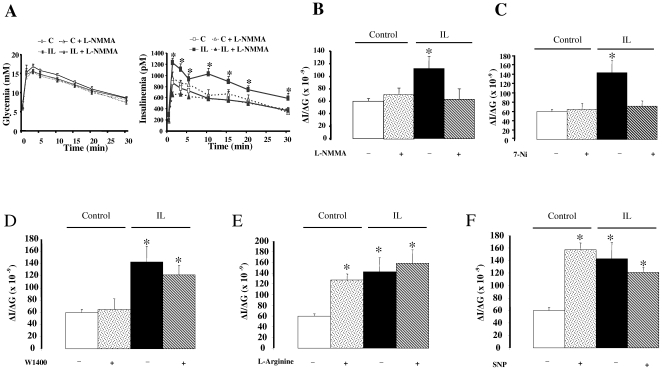
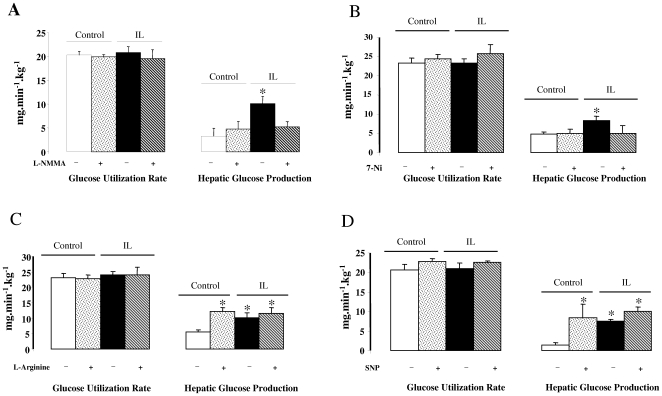
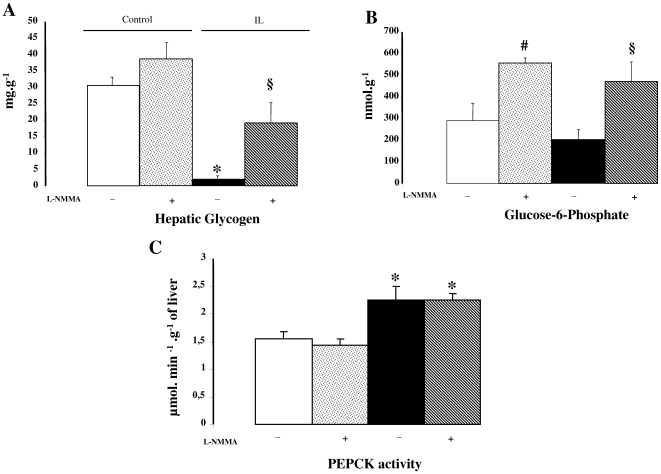
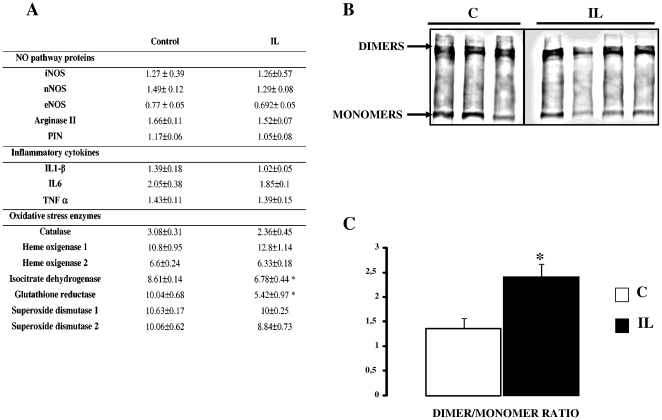
Principal findings: Lipids infusion led to hepatic insulin-resistance partly related to a decreased parasympathetic activity in the liver assessed by an increased acetylcholinesterase activity. Hypothalamic nitric oxide synthases (NOS) activities were significantly increased in IL rats, as the catalytically active neuronal NOS (nNOS) dimers compared to controls. This was related to a decrease in expression of protein inhibitor of nNOS (PIN). Effect of IL infusion on deregulated hepatic insulin-sensitivity was reversed by carotid injection of non selective NOS inhibitor NG-monomethyl-L-arginine (L-NMMA) and also by a selective inhibitor of the nNOS isoform, 7-Nitro-Indazole (7-Ni). In addition, NO donor injection (L-arginine and SNP) within carotid in control rats mimicked lipid effects onto impaired hepatic insulin sensitivity. In parallel we showed that cultured VMH neurons produce NO in response to fatty acid (oleic acid).
Conclusions/significance: We conclude that cerebral fatty acid overload induces an enhancement of nNOS activity within hypothalamus which is, at least in part, responsible fatty acid increased hepatic glucose production.
Conflict of interest statement
Figures
Similar articles
-
Ventromedial hypothalamic nitric oxide production is necessary for hypoglycemia detection and counterregulation.Diabetes. 2010 Feb;59(2):519-28. doi: 10.2337/db09-0421. Epub 2009 Nov 23. Diabetes. 2010. PMID: 19934009 Free PMC article.
-
Changes in the dimeric state of neuronal nitric oxide synthase affect the kinetics of secretagogue-induced insulin response.Diabetes. 2004 Jun;53(6):1467-74. doi: 10.2337/diabetes.53.6.1467. Diabetes. 2004. PMID: 15161750
-
Insulin sensitivity is mediated by the activation of the ACh/NO/cGMP pathway in rat liver.Am J Physiol Gastrointest Liver Physiol. 2004 Sep;287(3):G527-32. doi: 10.1152/ajpgi.00085.2004. Am J Physiol Gastrointest Liver Physiol. 2004. PMID: 15331351
-
Reduced ventromedial hypothalamic neuronal nitric oxide synthase and increased sensitivity to NOS inhibition in dietary obese rats: further evidence of a role for nitric oxide in the regulation of energy balance.Brain Res. 2004 Aug 6;1016(2):222-8. doi: 10.1016/j.brainres.2004.05.007. Brain Res. 2004. PMID: 15246858
-
Nitric oxide in the hypothalamus-pituitary axis mediates increases in brain glucose retention induced by carotid chemoreceptor stimulation with cyanide in rats.Nitric Oxide. 2010 May 15;22(4):296-303. doi: 10.1016/j.niox.2010.02.003. Epub 2010 Feb 13. Nitric Oxide. 2010. PMID: 20156578
Cited by
-
Hepatic nitric oxide synthase 1 adaptor protein regulates glucose homeostasis and hepatic insulin sensitivity in obese mice depending on its PDZ binding domain.EBioMedicine. 2019 Sep;47:352-364. doi: 10.1016/j.ebiom.2019.08.033. Epub 2019 Aug 28. EBioMedicine. 2019. PMID: 31473185 Free PMC article.
-
Fatty acid transporter CD36 mediates hypothalamic effect of fatty acids on food intake in rats.PLoS One. 2013 Sep 6;8(9):e74021. doi: 10.1371/journal.pone.0074021. eCollection 2013. PLoS One. 2013. PMID: 24040150 Free PMC article.
-
Hypothalamic glucose sensing: making ends meet.Front Syst Neurosci. 2014 Dec 10;8:236. doi: 10.3389/fnsys.2014.00236. eCollection 2014. Front Syst Neurosci. 2014. PMID: 25540613 Free PMC article. Review.
-
Lipid-induced peroxidation in the intestine is involved in glucose homeostasis imbalance in mice.PLoS One. 2011;6(6):e21184. doi: 10.1371/journal.pone.0021184. Epub 2011 Jun 16. PLoS One. 2011. PMID: 21698161 Free PMC article.
References
-
- Eckel RH, Grundy SM, Zimmet PZ. The metabolic syndrome. Lancet. 2005;365:1415–1428. - PubMed
-
- Levin BE, Magnan C, Migrenne S, Chua SC, Jr, Dunn-Meynell AA. F-DIO obesity-prone rat is insulin resistant before obesity onset. Am J Physiol Regul Integr Comp Physiol. 2005;289:R704–711. - PubMed
-
- Levin B. Reduced norepinephrine turnover in organs and brains of obesity-prone rats. Am J Physiol. 1995;268:R389–R394. - PubMed
-
- Tataranni PA, Young JB, Bogardus C, Ravussin E. A low sympathoadrenal activity is associated with body weight gain and development of central adiposity in Pima Indian men. Obes Res. 1997;5:341–347. - PubMed
-
- Penicaud L, Leloup C, Fioramonti X, Lorsignol A, Benani A. Brain glucose sensing: a subtle mechanism. Curr Opin Clin Nutr Metab Care. 2006;9:458–462. - PubMed
Publication types
MeSH terms
Substances
Grants and funding
LinkOut - more resources
Full Text Sources
