. 2009 Aug 14;4(8):e6646.
doi: 10.1371/journal.pone.0006646.

Genome-wide mRNA expression analysis of hepatic adaptation to high-fat diets reveals switch from an inflammatory to steatotic transcriptional program

Affiliations

Genome-wide mRNA expression analysis of hepatic adaptation to high-fat diets reveals switch from an inflammatory to steatotic transcriptional program

Marijana Radonjic et al. PLoS One. .

Abstract

Background: Excessive exposure to dietary fats is an important factor in the initiation of obesity and metabolic syndrome associated pathologies. The cellular processes associated with the onset and progression of diet-induced metabolic syndrome are insufficiently understood.

Principal findings: To identify the mechanisms underlying the pathological changes associated with short and long-term exposure to excess dietary fat, hepatic gene expression of ApoE3Leiden mice fed chow and two types of high-fat (HF) diets was monitored using microarrays during a 16-week period. A functional characterization of 1663 HF-responsive genes reveals perturbations in lipid, cholesterol and oxidative metabolism, immune and inflammatory responses and stress-related pathways. The major changes in gene expression take place during the early (day 3) and late (week 12) phases of HF feeding. This is also associated with characteristic opposite regulation of many HF-affected pathways between these two phases. The most prominent switch occurs in the expression of inflammatory/immune pathways (early activation, late repression) and lipogenic/adipogenic pathways (early repression, late activation). Transcriptional network analysis identifies NF-kappaB, NEMO, Akt, PPARgamma and SREBP1 as the key controllers of these processes and suggests that direct regulatory interactions between these factors may govern the transition from early (stressed, inflammatory) to late (pathological, steatotic) hepatic adaptation to HF feeding. This transition observed by hepatic gene expression analysis is confirmed by expression of inflammatory proteins in plasma and the late increase in hepatic triglyceride content. In addition, the genes most predictive of fat accumulation in liver during 16-week high-fat feeding period are uncovered by regression analysis of hepatic gene expression and triglyceride levels.

Conclusions: The transition from an inflammatory to a steatotic transcriptional program, possibly driven by the reciprocal activation of NF-kappaB and PPARgamma regulators, emerges as the principal signature of the hepatic adaptation to excess dietary fat. These findings may be of essential interest for devising new strategies aiming to prevent the progression of high-fat diet induced pathologies.


Conflict of interest statement

Competing Interests: The authors have declared that no competing interests exist.

Figures

Figure 1
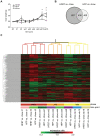
Figure 1. Increased body weight and gene expression changes induced by HFBT and HFP high-fat diets.
(A) Average body weight of ApoE3L mice fed either chow, HFBT or HFP diet in each time point of the 16-week time course. Error bars represent standard deviation within a group. Statistically significant (p<0.05) increase in body weight of HFBT and HFP fed mice compared to chow fed mice are marked with asterisk and hash sign, respectively. (B) Overlap between the total numbers of statistically significant differentially expressed genes in livers of ApoE3L mice fed either HFBT or HFP diet compared to chow diet per time-point, over the 16-week time-course. (C) Hierarchical clustering (Pearson correlation, complete linkage) of 16 experimental conditions (two high-fat diets at 8 time-points) and 1663 genes differentially expressed under either of two high-fat conditions. Values used for clustering are average HFBT vs. chow and HFP vs. chow per time-point expression ratios. The branches of the condition tree are colored so to discriminate three subclusters with the largest distance, corresponding to three phases of the time-course: early (red), mid (orange) and late (yellow). This is summarized in the color bar underneath the cluster diagram. The lower color bar indicates distinct time-points, stressing the similarity of HFBT and HFP transcriptional response at each point of the time-course.
Figure 2
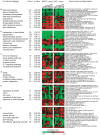
Figure 2. Functional characterization of the high-fat responsive genes.
Representative overrepresented functional categories in the set of 1663 high-fat responsive genes are grouped according to their biological function: (a) lipid and cholesterol metabolism, (b) oxidative and metabolic processes, (c) inflammatory and immune response, (d) apoptosis and protein folding, (e) cell growth and cell cycle and (f) transcription regulation and signal transduction. For each functional group, representative genes are listed and their expression profiles (average HFBT vs. chow and HFP vs. chow expression ratios per time-point) are shown in the adjacent diagrams.
Figure 3
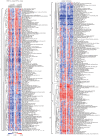
Figure 3. Temporal modules of pathway activities during the hepatic high-fat response.
Hierarchical clustering (Pearson correlation (uncentered), average linkage) of Normalized Enrichment Scores (NES), as determined by Gene Set Enrichment Analysis. The NES values of 314 gene sets, significant (FDR q-value<0.1) in at least one of HFBT vs. chow and HFP vs. chow per time-point comparisons are used as an input for hierarchical clustering. The NES scores, represented by the color gradient, correspond to the relative up- (red) and down- (blue) regulation of the gene sets under each of experimental conditions. The cluster diagram can be divided into five main temporal themes (depicted as modules 1 to 5), highlighting the main trends in temporal pathway activities: (1) early activation/late repression; (2) constant repression; (4) constant activation and (5) early repression/mid and late activation. Module (3) includes fuzzy pathway profiles that bring to light differences in transcription response to beef tallow- (HFBT) and palm oil-based (HFP) high-fat diets.
Figure 4
Figure 4. Molecular network underlying hepatic response to high-fat diets (day 3).
The global molecular associations of the high-fat responsive genes are functionally characterized and divided into networks based on the functions and/or diseases that are most significant to the network objects (Ingenuity Pathway Analysis). Depicted is the result of merging the network 1 (Immune Response, Tissue Development, Skeletal and Muscular System Development and Function), network 2 (Cellular Development, Connective Tissue Development and Function, Lipid Metabolism) and network 4 (Hepatic System Disease, Liver Steatosis, Cancer). The overrepresented “Function and disease” (Fx) categories “immune response” and “hepatic steatosis” are overlaid onto resulting network, showing which genes (nodes) are directly involved in these processes. The interactions between nodes that are directly connected to both processes are highlighted in pink. Color coding of the nodes corresponds to the direction of gene expression changes at day 3 in HFBT vs. chow diet comparison (upregulated genes are shown in red and downregulated in green).
Figure 5
Figure 5. Molecular network underlying hepatic response to high-fat diets (week 12).
The equivalent network to that in Figure 4, except that the color coding of the nodes corresponds to the direction of gene expression changes at week 12 in HFBT vs. chow diet comparison.
Figure 6
Figure 6. Reciprocal activation of regulators of an inflammatory and steatotic transcriptional programs during high-fat feeding time-course.
The average gene expression profiles of NF-kB regulators (RelB, IKBKG, IKBKE, IKBKAP) (red line) and PPARγ/hepatic steatosis-associated genes (PPARγ, SREBF1, SCD1, ACOX1, CIDEC, CFD) (yellow line) during the 16-week high-fat feeding time-course. (A) HFBT vs. chow diet. (B) HFP vs. chow diet.
Figure 7
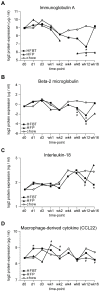
Figure 7. Expression changes of plasma proteins caused by HFBT and HFP high-fat diets.
Expression changes of a subset of inflammatory plasma proteins that show trend of early activation coupled with late repression compared to the control condition during the 16-week high-fat (HF) feeding time-course, as measured by multiplex immunoassay. Plotted are average protein expression levels per time point in mice fed chow, HFBT and HFP diets. Statistically significant changes in protein expression of HFBT and HFP fed mice compared to chow fed mice per time-point are marked with asterisk and hash symbol, respectively (p value<0.05). All four proteins are associated with NF-κB activation. (A) Immunoglobulin A, protein that activates NF-κB. (B–D) Beta-2 microglobulin, Interleukin-18 and Macrophage-derived chemokine (CCL22), proteins activated by NF-κB.
Figure 8
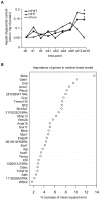
Figure 8. Regression analysis of gene expression and hepatic triglyceride content in chow and high-fat-fed ApoE3L mice.
(A) Changes in hepatic triglyceride (TG) content induced by HFBT and HFP high-fat diets and a control (chow) diet during the 16-week time course. Plotted are average values of hepatic triglyceride levels per time point in each of the three diets. Statistically significant increase (p≤0.01) in hepatic TG content of HFBT and HFP fed mice compared to chow fed mice (marked with asterisk and hash symbol, respectively) was observed at the time-point 16 weeks, indicating development of hepatic steatosis. (B) The most important genes for the prediction of hepatic triglyceride levels, as assessed by Random Forests Regression analysis. The expression of 1663 high-fat responsive genes and the hepatic triglyceride levels in each animal were used as an input for the regression analysis. The plot shows the importance of the top 30 genes in the Random Forest regression model. The importance of a gene in the model is expressed as the increase of Mean Squared Error (MSE) when the gene is excluded from the analysis. Higher the percentage of increase of MSE, the more important the particular gene is for the prediction of the hepatic TG levels. The genes identified as steatosis-associated by the network analysis, such as ACOX1, SCD, PPARγ, CFD and CIDEC are also discovered among the top 30 genes resulting from the regression analysis of gene expression and hepatic TG levels.
Figure 9
Figure 9. Model of the hepatic physiological response to high-fat diets during the 16-week time-course.
The summary of a proposed model for the hepatic physiological changes in response to high-fat diets during the 16-week time-course in ApoE3L mice. The initial perturbation of hepatic homeostasis by excess dietary fat triggers the stress response largely controlled by NF-κB and Akt regulators and manifested in activation of acute phase response, inflammation, immune response, hepatic regeneration-like response and lipotoxicity (day 1 to week 1). Upon prolonged high-fat feeding, liver fails to regain the basal state and consequently shifts to pathological state controlled by PPAR and SREBP regulators and characterized by hepatic lipid accumulation and adipogenic transformation, indicative of hepatic steatosis (late phase, week 8 to week 16). The flagship processes induced at the early and at the late phase are shown in boxes. The transition between the stressed and the pathological hepatic state may be controlled by trans-inhibitory interactions between NF-κB and PPARγ regulators, resulting in the tradeoff between inflammatory and steatotic transcription programs (mid phase, week 2 to week 4). On the systems level, the activation of steatotic program is followed by other metabolic syndrome associated pathologies such as obesity and whole-body insulin resistance.

Similar articles

Cited by

References

    1. Kopelman PG. Obesity as a medical problem. Nature. 2000;404:635–643. - PubMed
    1. Kopelman PG, Grace C. New thoughts on managing obesity. Gut. 2004;53:1044–1053. - PMC - PubMed
    1. Ogden CL, Yanovski SZ, Carroll MD, Flegal KM. The epidemiology of obesity. Gastroenterology. 2007;132:2087–2102. - PubMed
    1. Lissner L, Heitmann BL. Dietary fat and obesity: evidence from epidemiology. Eur J Clin Nutr. 1995;49:79–90. - PubMed
    1. Buettner R, Scholmerich J, Bollheimer LC. High-fat diets: modeling the metabolic disorders of human obesity in rodents. Obesity (Silver Spring) 2007;15:798–808. - PubMed

Publication types