Review
. 2009 Sep 7;9(17):2537-50.
doi: 10.1039/b822948c. Epub 2009 Aug 12.

Characterizing dispersion in microfluidic channels

Affiliations
Review

Characterizing dispersion in microfluidic channels

Subhra Datta et al. Lab Chip. .

Abstract

Dispersion or spreading of analyte bands is a barrier to achieving high resolution in microfluidic separations. The role of dispersion in separations is reviewed with emphasis on metrics, sources and common principles of analysis. Three sources of dispersion (a) inhomogeneous flow fields, (b) solute wall interactions and (c) force fields normal to channel walls are studied in detail. Microfluidic and nanofluidic applications to capillary electrophoresis, chromatography and field-flow fractionation, that are subject to one or more of these three physical processes under standard, unintentional or novel operating conditions, are discussed.


Figures
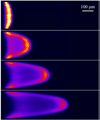
FIG. 1
FIG. 1
Dispersion of a fluorescent dye in a 250 µm × 70 µm rectangular microchannel under pressure-driven flow. See [9], used here with permission of the authors.
FIG. 2
FIG. 2
Schematic of a microfluidic chip with separation and injection channels crossing each other. The distance L between injection and detection ports on the separation channel is typically of the order of several centimeters and the channel width is typically of the order of several tens of microns.
FIG. 3
FIG. 3
Chromatograms showing different composition of white (top) and red (bottom) wines [17]. An optical detection method was used; the number of mAU (milli-absorbance units) for each peak is proportional to the concentration of each constituent (1. Prothocatechuic acid; 2. Gallic acid; 3. (+)-Catechin; 4. (−)-Epicatechin; 5. trans-resveratrol; 6. Rutin). Used with permission of the authors.
FIG. 4
FIG. 4
Effective dispersion coefficient (Deff) vs. time (t) for electroosmotic flow with mean velocity ū under an axially varying zeta potential of wavelength Λ in a square channel of side 2b calculated from three-dimensional numerical simulation (solid line) and simulation of one-dimensional asymptotic equations (circular symbols) [62]. Parameters are, top panel: Λ = L/5 = 51.2b, center panel: Λ = L/10 = 25.6b and lower panel: Λ = L/25 = 10.24b respectively. The amplitude Δζ of the zeta potential variation was 75% of the axial average 〈ζ〉 of the zeta potential. The Peclet number (2bū/D) was 5. See [62].
FIG. 5
FIG. 5
Effective Dispersion Coefficient (Deff) at the detection time t = 16b/ū vs. adsorption rate constant (λKPe) for a neutral analyte suffering wall adsorption according to a linear kinetic law while being transported by an electroosmotic flow in a square microchannel of side 2b calculated from 3-D numerical simulation, 1-D numerical simulation and chromatographic theory of analyte transport. The dimensionless adsorption rate constant λ = 2kdb/ū is varied keeping the dimensionless equilibrium constant K = ka/(2kdb) = 1 and Pe = ū(2b)/D = 10 fixed. Results from three-dimensional numerical simulation are represented by asterisks and results from simulation of the asymptotically reduced model (Equation (3.3)) are represented by circular symbols. The solid line is the effective dispersion coefficient calculated from the theory of chromatography. Here, Pe = ū(2b)/D = 10 and the length of simulation domain L = 40b. See [62].
FIG. 6
FIG. 6
Figure 6(a), adapted from [89], shows the setup used in their electrokinetic transport experiments of Garcia et al.. Figure 6(b), adapted from [89], is a fluorescence micrograph of the nanochannel region of Figure 6(a), showing the separation of the negatively charged dye Alexa 488 (green) from the neutral dye Rhodamine B (red), under an electroosmotic flow. Figure 6(c), adapted from [40], shows epifluorescence images of the transport of the charged dyes bodipy and fluorescein in a 2 µm deep microchannel (top pane), and in a 40 nm deep nanochannel (bottom pane), as observed by Pennathur and Santiago. Figure 6(b)–6(c) demonstrate the autogenous field-flow fractionation effect [41] of the electrical double layers within a nanochannel. Figures 6(a) and 6(b) are reproduced by permission of The Royal Society of Chemistry. Figure 6(c) is reproduced by permission of the American Chemical Society.
FIG. 7
FIG. 7
The retention ratio of ions in autogenous electric field-flow fractionation under pressure-driven flow in a nanochannel of width 2h with a positive zeta potential of kT/e on the walls as a function of the scaled Debye Hückel parameter κh. Z is the valence of the ion. See also [41].
FIG. 8
FIG. 8
The dispersivity of ions γ normalized by the Taylor dispersivity γp=2105 in autogenous electric field-flow fractionation under pressure-driven flow in a nanochannel of width 2h with a positive zeta potential of kT/e on the walls as a function of the scaled Debye Hückel parameter κh. Z is the valence of the ion. See also [41].

References

    1. Giddings J. Dynamics of Chromatography, Part I, Principles and Theory. New York, U.S.A: Marcel Dekker, Inc.; 1965.
    1. Taylor G. Proc. Roy. Soc. A. 1953;219:186.
    1. Bello M, Rezzonico R, Righetti P. Science. 1994;266:773. - PubMed
    1. Brenner H, Edwards D. Macrotransport Processes. Butterworth-Heinemann; 1993.
    1. Bloechle B. Ph.D. thesis. University of Colorado; 2001.

Publication types