Review
. 2010 Mar;39(4):527-40.
doi: 10.1007/s00249-009-0517-y. Epub 2009 Aug 13.

In vivo magnetic resonance spectroscopy: basic methodology and clinical applications

Affiliations
Review

In vivo magnetic resonance spectroscopy: basic methodology and clinical applications

Marinette van der Graaf. Eur Biophys J. 2010 Mar.

Abstract

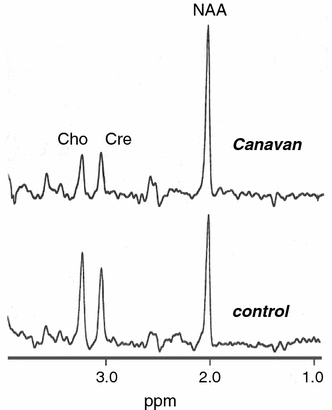
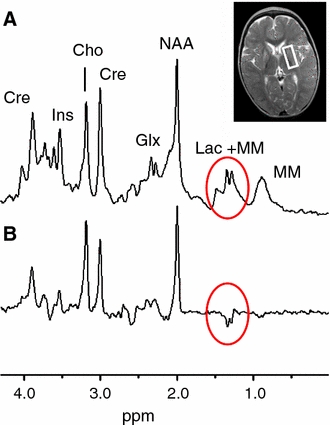
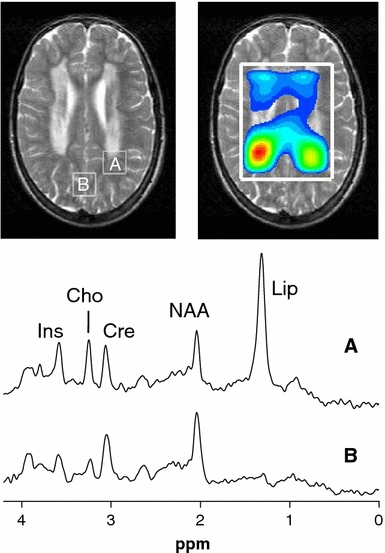
The clinical use of in vivo magnetic resonance spectroscopy (MRS) has been limited for a long time, mainly due to its low sensitivity. However, with the advent of clinical MR systems with higher magnetic field strengths such as 3 Tesla, the development of better coils, and the design of optimized radio-frequency pulses, sensitivity has been considerably improved. Therefore, in vivo MRS has become a technique that is routinely used more and more in the clinic. In this review, the basic methodology of in vivo MRS is described-mainly focused on (1)H MRS of the brain-with attention to hardware requirements, patient safety, acquisition methods, data post-processing, and quantification. Furthermore, examples of clinical applications of in vivo brain MRS in two interesting fields are described. First, together with a description of the major resonances present in brain MR spectra, several examples are presented of deviations from the normal spectral pattern associated with inborn errors of metabolism. Second, through examples of MR spectra of brain tumors, it is shown that MRS can play an important role in oncology.


Figures

Fig. 1
Fig. 1
Pediatric patient positioned in the headcoil on the table of the MR system just before the table with patient and coil is moved into the magnetic bore for the MR investigation
Fig. 2
Fig. 2
Schematic overview of the pulse sequences PRESS and STEAM. It should be noted that each of the three RF pulses is combined with a gradient in three different directions (X, Y, and Z) to allow selection of a rectangular volume. RF Radio frequency, tau time delay between 90° and 180° pulses in PRESS, TE echo time, TM mixing time
Fig. 3
Fig. 3
Single-voxel MR spectra obtained at a field strength of 3T from white matter (left) and gray matter (right) from a healthy volunteer. The voxel positions are indicated in the corresponding MR images. Spectra were obtained with PRESS volume selection (TE/TR = 20/5,000 ms for upper row and TE/TR = 136/2,000 ms for lower row). The most prominent signals are labeled: Cre creatine, Ins myo-inositol, Cho choline, Glx glutamine and glutamate, NAA N-acetyl aspartate, MM macromolecules. Note the difference in relative signal intensities of Cho and Cre in white and gray matter, for which the labels are indicated in blue
Fig. 4a–d
Fig. 4a–d
Magnetic resonance spectroscopic imaging (MRSI) data obtained from a patient with a brain tumor (low-grade oligodendroglioma). a MR image with volume of interest selected by STEAM in white and two-dimensional MRSI grid in blue. Spectra are only acquired from the MRSI voxels inside the volume of interest. The dotted line in a indicates the MRSI voxels shown in b. b Part of the spectral image showing MRSI voxels with their corresponding spectra. c Enlargement of the spectrum obtained from the voxel indicated in red in b and c. The spectrum (TE = 20 ms) shows a typical pattern for a low-grade brain tumor with increased choline, decreased NAA, and the doublet of lactate. d Metabolite map showing the intensity distribution of the ratio of choline to NAA over the volume of interest with the highest intensity indicated in red at the position of the tumor
Fig. 5
Fig. 5
MR spectra obtained at 1.5 T (TE/TR = 135/2,000 ms) of parietal white matter of a 13-month-old patient with Canavan disease (upper row) and an age-matched control (lower row). Note the remarkable increase in NAA signal in the spectrum of the patient, together with decreases in choline and creatine
Fig. 6a, b
Fig. 6a, b
MR spectra obtained at 3T of basal ganglia (voxel indicated on MR image) of a patient with Leigh syndrome, a mitochondrial disorder. Spectra were obtained with PRESS volume selection (TE/TR = 20/5,000 ms for a and TE/TR = 136/2,000 ms for b). In a increased lactate is present as a positive doublet at 1.3 ppm on top of the broad signal of macromolecules. In spectrum b, obtained with a longer TE of 136 ms, the broad signal of macromolecules is not present, and the lactate doublet is inverted
Fig. 7
Fig. 7
MR spectra obtained at 3T (PRESS, TE/TR = 20/5,000 ms) from white (a) and gray matter (b) of a patient with Sjögren–Larsson syndrome. The spectrum of white matter clearly shows the presence of an intense lipid signal, caused by a defect in the enzyme fatty aldehyde dehydrogenase, while this resonance is absent in the spectrum of gray matter. In addition, the white-matter spectrum shows slightly increased signals of choline, creatine, and myo-inositol, associated with myelin abnormalities. The metabolite map of the lipid (top right) depicts its distribution with the highest intensities in the periventricular regions around the posterior and frontal trigones of the ventricles
Fig. 8a–c
Fig. 8a–c
On the left, an MR image of a patient with a glioblastoma multiforme showing regions with enhanced signal intensity after contrast administration, which is indicative of a defective blood–brain barrier as is often present in high-grade brain tumors. An MRSI grid is superimposed on the MR image with three voxel positions labeled AC, for which the corresponding spectra (acquired with TE = 20 ms) are presented. The variety in the spectral patterns is indicative of the tissue heterogeneity inside the brain tumor, from viable tumor tissue with a high choline signal (a) to necrotic tissue represented by only a lipid signal (c)
Fig. 9a–c
Fig. 9a–c
MR image with enhanced signal intensity after contrast administration, which could be caused by the presence of a metastasis or radiation necrosis, together with an MRSI grid (TE = 20 ms). a Spectrum of voxel in enhancing region with rather normal intensities of the major brain metabolites creatine, choline, and NAA and a large lipid resonance. b Spectrum of contralateral voxel in healthy tissue showing a normal pattern of brain metabolite signals. c Spectrum of a metastasis obtained from another patient. Based upon the pattern of spectrum a, the diagnosis of radiation necrosis could be made

References

    1. Ardenkjaer-Larsen JH, Fridlund B, Gram A, Hansson G, Hansson L, Lerche MH, Servin R, Thaning M, Golman K. Increase in signal-to-noise ratio of >10, 000 times in liquid-state NMR. Proc Natl Acad Sci USA. 2003;100:10158–10163. doi: 10.1073/pnas.1733835100. - DOI - PMC - PubMed
    1. Argov Z, Löfberg M, Arnold DL. Insights into muscle diseases gained by phosphorus magnetic resonance spectroscopy. Muscle Nerve. 2000;23:1316–1334. doi: 10.1002/1097-4598(200009)23:9<1316::AID-MUS2>3.0.CO;2-I. - DOI - PubMed
    1. Baslow MH. Evidence supporting a role for N-acetyl-L-aspartate as a molecular water pump in myelinated neurons in the central nervous system. An analytical review. Neurochem Int. 2002;40:295–300. doi: 10.1016/S0197-0186(01)00095-X. - DOI - PubMed
    1. Blüml S, Moreno A, Hwang JH, Ross BD. 1-(13)C glucose magnetic resonance spectroscopy of pediatric and adult brain disorders. NMR Biomed. 2001;14:19–32. doi: 10.1002/nbm.679. - DOI - PubMed
    1. Bolan PJ, Nelson MT, Yee D, Garwood M. Imaging in breast cancer: magnetic resonance spectroscopy. Breast Cancer Res. 2005;7:149–152. doi: 10.1186/bcr1202. - DOI - PMC - PubMed

Publication types