

The greenhouse gas emissions performance of cellulosic ethanol supply chains in Europe
- PMID: 19682352
- PMCID: PMC2746206
- DOI: 10.1186/1754-6834-2-15
The greenhouse gas emissions performance of cellulosic ethanol supply chains in Europe
Abstract
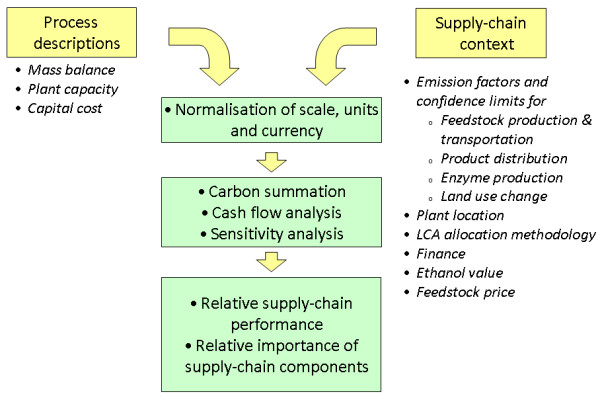
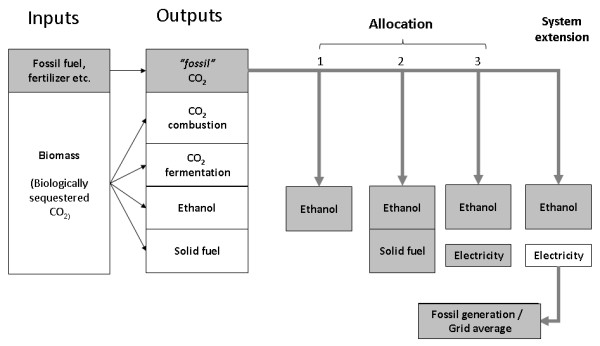
Background: Calculating the greenhouse gas savings that may be attributed to biofuels is problematic because production systems are inherently complex and methods used to quantify savings are subjective. Differing approaches and interpretations have fuelled a debate about the environmental merit of biofuels, and consequently about the level of policy support that can be justified. This paper estimates and compares emissions from plausible supply chains for lignocellulosic ethanol production, exemplified using data specific to the UK and Sweden. The common elements that give rise to the greatest greenhouse gas emissions are identified and the sensitivity of total emissions to variations in these elements is estimated. The implications of including consequential impacts including indirect land-use change, and the effects of selecting alternative allocation methods on the interpretation of results are discussed.
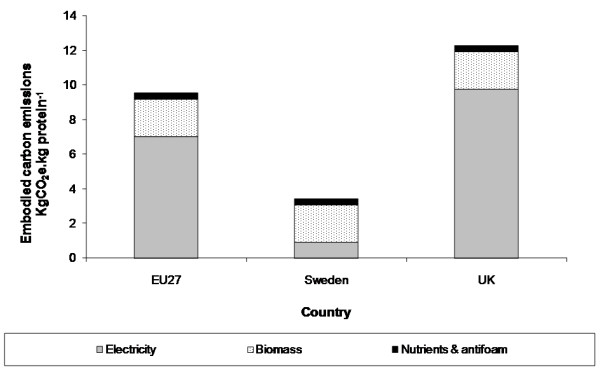
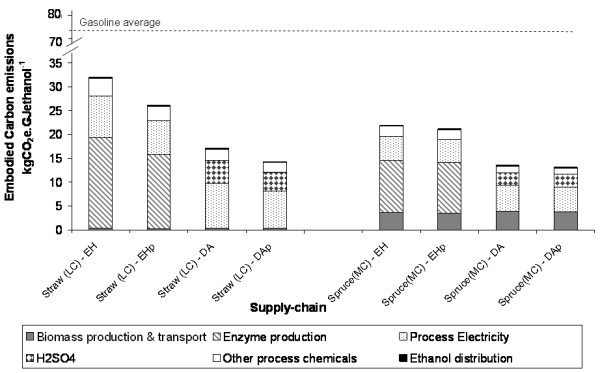
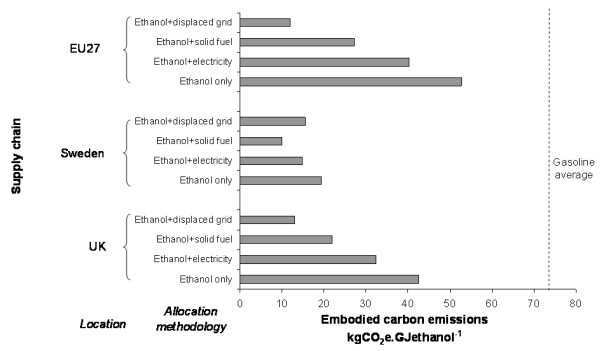
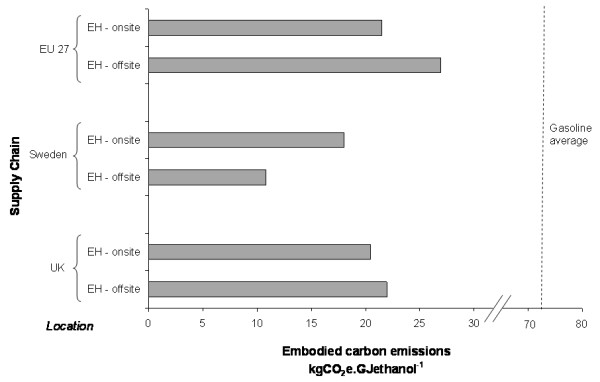
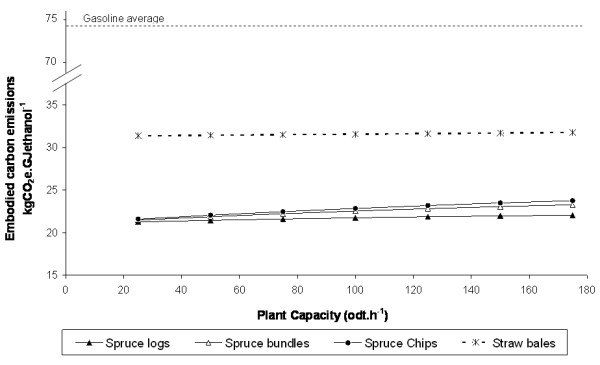
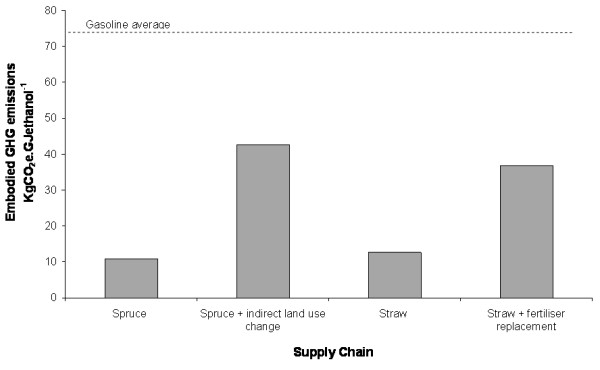
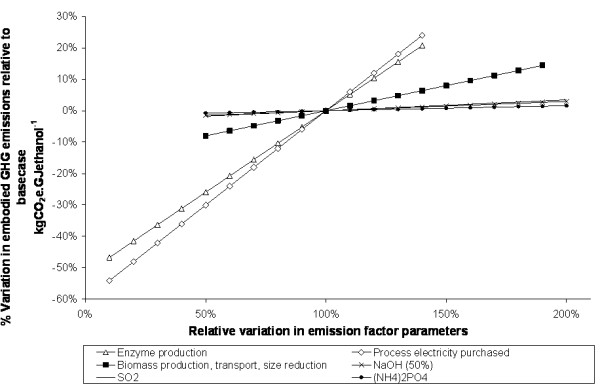
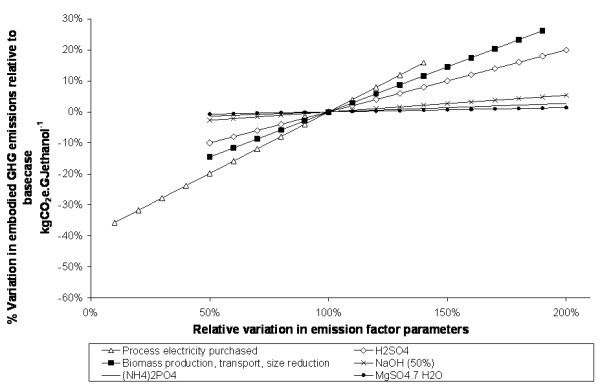
Results: We find that the most important factors affecting supply chain emissions are the emissions embodied in biomass production, the use of electricity in the conversion process and potentially consequential impacts: indirect land-use change and fertiliser replacement. The large quantity of electricity consumed during enzyme manufacture suggests that enzymatic conversion processes may give rise to greater greenhouse gas emissions than the dilute acid conversion process, even though the dilute acid process has a somewhat lower ethanol yield.
Conclusion: The lignocellulosic ethanol supply chains considered here all lead to greenhouse gas savings relative to gasoline An important caveat to this is that if lignocellulosic ethanol production uses feedstocks that lead to indirect land-use change, or other significant consequential impacts, the benefit may be greatly reduced.Co-locating ethanol, electricity generation and enzyme production in a single facility may improve performance, particularly if this allows the number of energy intensive steps in enzyme production to be reduced, or if other process synergies are available. If biofuels policy in the EU remains contingent on favourable environmental performance then the multi-scale nature of bioenergy supply chains presents a genuine challenge. Lignocellulosic ethanol holds promise for emission reductions, but maximising greenhouse gas savings will not only require efficient supply chain design but also a better understanding of the spatial and temporal factors which affect overall performance.
Figures
References
-
- Géraldine Kutas, Carina Lindberg, Steenblik R. Biofuels at what cost? Government support for ethanol and biodiesel in the European Union. Geneva, Switzerland: Global Subsidies Initiative (GSI) of the International Institute for Sustainable Development (IISD); 2007.
-
- Commission of the European Communities Proposal for a directive on the promotion of the use of energy from renewable sources. COM(2008) 30 final. . Brussels. 2008.
-
- Farrell A. The low carbon fuel standard and land use change. Western States Petroleum Association Lifecycle Analysis Collaborative Sacramento, CA. 2008 doi: 10.1186/1754-6834-2-3. - DOI
