. 2009 Dec 1;671(1-2):13-9.
doi: 10.1016/j.mrfmmm.2009.08.003. Epub 2009 Aug 12.

Differences between human slow N-acetyltransferase 2 alleles in levels of 4-aminobiphenyl-induced DNA adducts and mutations

Affiliations

Differences between human slow N-acetyltransferase 2 alleles in levels of 4-aminobiphenyl-induced DNA adducts and mutations

Jean Bendaly et al. Mutat Res. .

Abstract

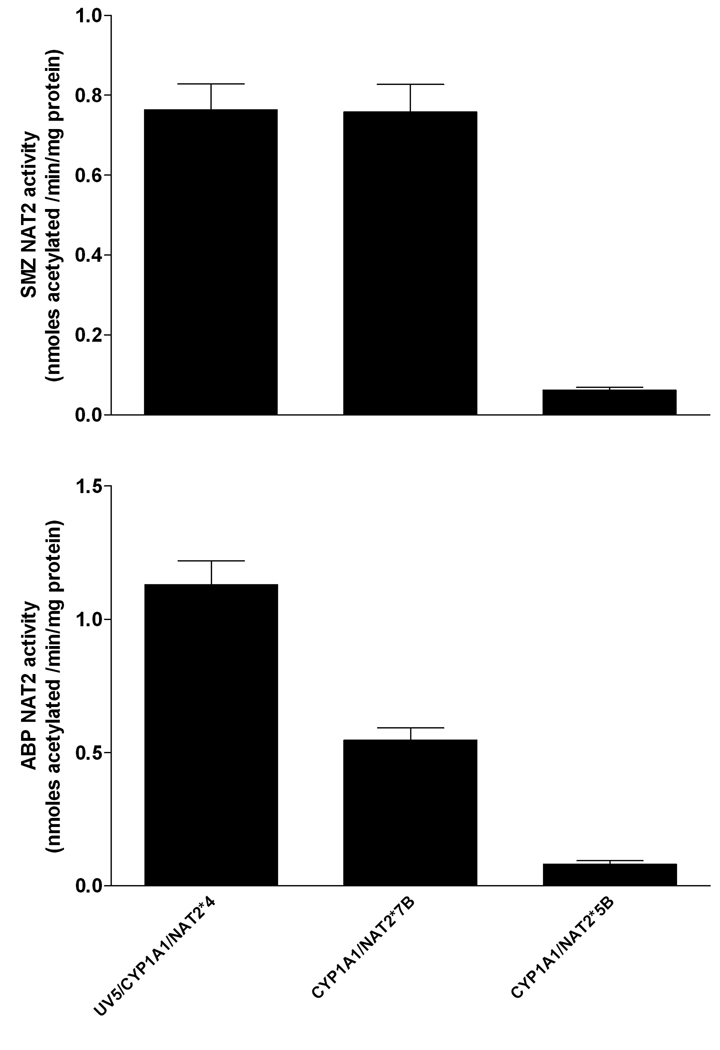
Aromatic amines such as 4-aminobiphenyl (ABP) require biotransformation to exert their carcinogenic effects. Genetic polymorphisms in biotransformation enzymes such as N-acetyltransferase 2 (NAT2) may modify cancer risk following exposure. Nucleotide excision repair-deficient Chinese hamster ovary (CHO) cells stably transfected with human cytochrome P4501A1 (CYP1A1) and a single copy of either NAT2*4 (rapid acetylator), NAT2*5B (common Caucasian slow acetylator), or NAT2*7B (common Asian slow acetylator) alleles (haplotypes) were treated with ABP to test the effect of NAT2 polymorphisms on DNA adduct formation and mutagenesis. ABP N-acetyltransferase catalytic activities were detectable only in cell lines transfected with NAT2 and were highest in cells transfected with NAT2*4, lower in cells transfected with NAT2*7B, and lowest in cells transfected with NAT2*5B. Following ABP treatment, N-(deoxyguanosin-8-yl)-4-aminobiphenyl (dG-C8-ABP) was the primary adduct formed. Cells transfected with both CYP1A1 and NAT2*4 showed the highest concentration-dependent cytotoxicity, hypoxanthine phosphoribosyl transferase (hprt) mutants, and dG-C8-ABP adducts. Cells transfected with CYP1A1 and NAT2*7B showed lower levels of cytotoxicity, hprt mutagenesis, and dG-C8-ABP adducts. Cells transfected with CYP1A1 only or cells transfected with both CYP1A1 and NAT2*5B did not induce cytotoxicity, hprt mutagenesis or dG-C8-ABP adducts. ABP-DNA adduct levels correlated very highly (r>0.96) with ABP-induced hprt mutant levels following each treatment. The results of the present study suggest that investigations of NAT2 genotype or phenotype associations with disease or toxicity could be more precise and reproducible if heterogeneity within the "slow" NAT2 acetylator phenotype is considered and incorporated into the study design.


Figures

Fig. 1
Fig. 1
Metabolic pathways for 4-aminobiphenyl.
Fig. 2
Fig. 2
NAT2 catalytic activities in cell lysates of CYP1A1/NAT2*4, CYP1A1/NAT2*7B- and CYP1A1/NAT2*5B-transfected CHO cells. Each bar represents Mean ± S.E.M. for three determinations. NAT2 activities in the UV5 and UV5/CYP1A1 cell lines were not detected (<20 pmole/min/mg). Sulfamethazine (SMZ) NAT2 catalytic activities (top) were significantly lower (p<0.001) in the CYP1A1/NAT2*5B- transfected cell line. ABP NAT2 catalytic activities (bottom) differed significantly (p<0.01) between all NAT2-transfected cell lines. ABP NAT2 activity was not detected in the UV5 and UV5/CYP1A1 cell lines (<10 pmol/min/mg protein).
Fig. 3
Fig. 3
A: Cell survival in UV5 CHO cell lines following treatment with ABP. Percent survival on the ordinate is plotted versus ABP treatment concentration on the abscissa. Each data point represents Mean ± S.E.M. for three to six experiments in UV5 (open circles), UV5/CYP1A1 (closed circles), UV5/CYP1A1/NAT2*5B (open squares), UV5/CYP1A1/NAT2*7B (closed squares), and UV5/CYP1A1/NAT2*4 (open triangles) cell lines. Cell survival differed significantly (p<0.001) in the order UV5/CYP1A1/NAT*4 < UV5/CYP1A1/NAT2*7B < UV5, UV5/CYP1A1, and UV5/CYP1A1/NAT2*5B following 2–4 µM ABP treatment. B: ABP -induced hprt mutants in UV5 CHO cell lines. ABP-induced hprt mutants are plotted on the ordinate versus treatment concentration on the abscissa. Each data point represents Mean ± S.E.M. for two to five experiments in UV5 (open circles), UV5/CYP1A1 (closed circles), UV5/CYP1A1/NAT2*5B (open squares), UV5/CYP1A1/NAT2*7B (closed squares), and UV5/CYP1A1/NAT2*4 (open triangles) cell lines. ABP -induced hprt mutants differed significantly in the order UV5/CYP1A1/NAT*4 > UV5/CYP1A1/NAT2*7B > UV5, UV5/CYP1A1, and UV5/CYP1A1/NAT2*5B following 1 µM (p<0.05) and 2–4 µM (p<0.001) ABP treatment.
Fig. 3
Fig. 3
A: Cell survival in UV5 CHO cell lines following treatment with ABP. Percent survival on the ordinate is plotted versus ABP treatment concentration on the abscissa. Each data point represents Mean ± S.E.M. for three to six experiments in UV5 (open circles), UV5/CYP1A1 (closed circles), UV5/CYP1A1/NAT2*5B (open squares), UV5/CYP1A1/NAT2*7B (closed squares), and UV5/CYP1A1/NAT2*4 (open triangles) cell lines. Cell survival differed significantly (p<0.001) in the order UV5/CYP1A1/NAT*4 < UV5/CYP1A1/NAT2*7B < UV5, UV5/CYP1A1, and UV5/CYP1A1/NAT2*5B following 2–4 µM ABP treatment. B: ABP -induced hprt mutants in UV5 CHO cell lines. ABP-induced hprt mutants are plotted on the ordinate versus treatment concentration on the abscissa. Each data point represents Mean ± S.E.M. for two to five experiments in UV5 (open circles), UV5/CYP1A1 (closed circles), UV5/CYP1A1/NAT2*5B (open squares), UV5/CYP1A1/NAT2*7B (closed squares), and UV5/CYP1A1/NAT2*4 (open triangles) cell lines. ABP -induced hprt mutants differed significantly in the order UV5/CYP1A1/NAT*4 > UV5/CYP1A1/NAT2*7B > UV5, UV5/CYP1A1, and UV5/CYP1A1/NAT2*5B following 1 µM (p<0.05) and 2–4 µM (p<0.001) ABP treatment.
Fig. 4
Fig. 4
Electrospray ionization spectra of dG-C8-ABP and dG-C8-ABP-D5. Collision induced dissociation fragmentation of dG-C8-ABP and dG-C8-ABP-D5 at −50 V collision energy (middle panels) shows fragmentation of the ABP and guanosine moieties dominated by the major fragment produced from loss of deoxyribose: the aglycone ion of m/z 319 or m/z 324 for dG-C8-ABP and dG-C8-ABP-D5, respectively. The collision energy was −25 V for multiple reaction monitoring transitions used during quantitation (lower panels).
Fig. 5
Fig. 5
ABP -induced dG-C8-ABP adduct levels in UV5 CHO cell lines. Adduct levels are plotted on the ordinate versus ABP treatment concentration on the abscissa. Each data point represents Mean ± S.E.M. for three experiments (the S.E.M. sometimes falls within the symbol) in UV5/CYP1A1/NAT2*5B (open squares), UV5/CYP1A1/NAT2*7B (closed squares), and UV5/CYP1A1/NAT2*4 (open triangles) cell lines. dG-C8-ABP DNA adduct levels were not detected in UV5 CHO cell lines, nor in CYP1A1- or CYP1A1/NAT2*5B- transfected cell lines (data not shown). dG-C8-ABP DNA adduct levels were significantly (p<0.001) higher in UV5/CYP1A1/NAT2*4 than UV5/CYP1A1/NAT2*7B cell lines at each ABP treatment concentration.

References

    1. Stabbert R, Schafer KH, Biefel C, Rustemeier K. Analysis of aromatic amines in cigarette smoke. Rapid Commun Mass Spectrom. 2003;17:2125–2132. - PubMed
    1. Baan R, Straif K, Grosse Y, Secretan B, Ghissassi FEl, Bouvard V, Benbrahim-Tallaa L, Cogliano V. Carcinogenicity of some aromatic amines, dyes, organic dyes, and related exposures. Lancet Oncol. 2008;9:322–323. - PubMed
    1. Kim D, Guengerich FP. Cytochrome P450 activation of arylamines and heterocyclic amines. Annu Rev Pharmacol Toxicol. 2005;45:27–49. - PubMed
    1. Dorrenhaus, Muller T, Roos PH. Increased CYP1A1 expression in human exfoliated urothelial cells of cigarette smokers compared to non-smokers. Arch Toxicol. 2007;81:19–25. - PubMed
    1. Tsuneoka Y, Dalton TP, Miller ML, Clay CD, Shertzer HG, Talaska G, Medvedovic M, Nebert DW. 4-aminobiphenyl-induced liver and urinary bladder DNA adduct formation in Cyp1a2(−/−) and Cyp1a2(+/+) mice. J Natl Cancer Inst. 2003;95:1227–1237. - PubMed

Publication types