. 2009 Aug 21;138(4):645-659.
doi: 10.1016/j.cell.2009.06.034. Epub 2009 Aug 13.

Identification of selective inhibitors of cancer stem cells by high-throughput screening

Affiliations

Identification of selective inhibitors of cancer stem cells by high-throughput screening

Piyush B Gupta et al. Cell. .

Abstract

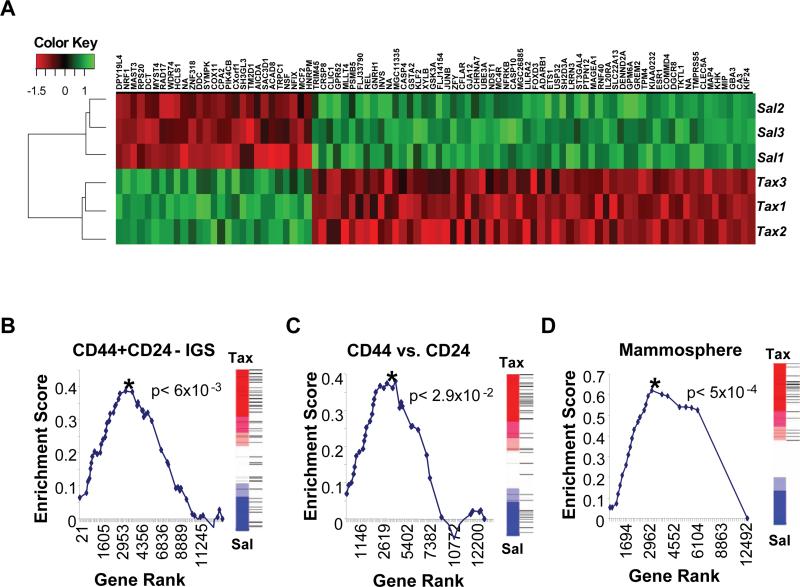
Screens for agents that specifically kill epithelial cancer stem cells (CSCs) have not been possible due to the rarity of these cells within tumor cell populations and their relative instability in culture. We describe here an approach to screening for agents with epithelial CSC-specific toxicity. We implemented this method in a chemical screen and discovered compounds showing selective toxicity for breast CSCs. One compound, salinomycin, reduces the proportion of CSCs by >100-fold relative to paclitaxel, a commonly used breast cancer chemotherapeutic drug. Treatment of mice with salinomycin inhibits mammary tumor growth in vivo and induces increased epithelial differentiation of tumor cells. In addition, global gene expression analyses show that salinomycin treatment results in the loss of expression of breast CSC genes previously identified by analyses of breast tissues isolated directly from patients. This study demonstrates the ability to identify agents with specific toxicity for epithelial CSCs.


Figures

Figure 1
Figure 1. Mesenchymally transdifferentiated breast epithelial cells have increased numbers of CSCs and are drug resistant
(a) Western blotting for E-cadherin, β-catenin and β-actin in HMLER cells expressing either GFP (shGFP) or the human ECAD gene (shEcad). Stable introduction of a murine ECAD gene (p.mEcad) but not GFP (p.GFP) results in re-expression of E-cadherin protein and reversal of EMT-associated morphology. (b) FACS with CD24 and CD44 markers; Percentage of the CD44+/CD24-subpopulation is indicated. (c) Mammosphere formation assays and (d) tumor-seeding with HMLERshCntrl and HMLERshEcad breast cancer cells. (e) Proliferation curves of HMLER-shCntrl and HMLER-shEcad cells grown in culture. Viable cells were counted by Trypan Blue dye-exclusion. (f) Dose-response curves of HMLERshEcad and HMLERshCntrl breast cancer cells treated with doxorubicin or paclitaxel. (g) Viability of immortalized, non-tumorigenic breast epithelial cells (HMLE shCntrl) and cells induced through EMT (HMLEshEcad) treated with various chemotherapy compounds (h) Proportion by FACS of GFP-labeled HMLEshEcad cells following paclitaxel treatment when mixed with control cells (HMLE) cells.
Figure 2
Figure 2. Chemical screening for compounds that selectively kill mesenchymally transdifferentiated immortalized epithelial cells
(a) Schematic of the screen design and protocol. (b) (i) Histogram of replicate-averaged background-corrected viability signal intensities (see Methods for details) for the viability of each tested compound for control breast epithelial cells (HMLEshCntrl). Low/high signal intensities indicate compounds that reduce/increase cell viability. (ii) XY-Scatter plot of normalized Z-scores for the viability of each tested compound for mesenchymally transdifferentiated breast epithelial cells (HMLEshEcad; red dots indicate DMSO treatment; blue dots indicate test compounds). Z-scoreA and Z-scoreB represent the normalized Z-scores for the two independent replicates of the screen. (iii) The data are as in (i) with the red shaded region in the histogram representing compounds that exhibited mild-to-strong toxicity (>1 S.D. lower than the mean normalized signal intensity) for the control HMLEshCntrl epithelial cells. Compounds within the red region in (iii) were filtered out of the plot in (ii), producing the scatter plot in (iv). Application of this selectivity filter resulted in the identification of compounds that selectively killed mesenchymally transdifferentiated HMLEshEcad but not control HMLEshCntrl epithelial cells (yellow dots).
Figure 3
Figure 3. Identification and validation of compounds that exhibit selective toxicity for mesenchymally transdifferentiated epithelial cells
(a) Chemical structure of salinomycin, etoposide, abamectin, and nigericin and dose-response curves of control HMLE-shCntrl cells and HMLE-shEcad cells treated with indicated compounds. (b) Dose-response curves of the viability of HMLE-shCntrl and HMLE-Twist cells. (c) Dose-response curves of control HMLER and HMLER-shEcad tumorigenic mammary epithelial cells treated with salinomycin, etoposide, abamectin, or nigericin. Each treatment combination was performed in at least 6 replicates.
Figure 4
Figure 4. Effect of salinomycin and paclitaxel treatment on breast CSC numbers
(a) HMLER cells were treated with DMSO, paclitaxel or salinomycin at the specified doses for 4 days, and then allowed for recover in the absence of treatment for 4 days. Percent of CD44high/CD24low cells after compound treatment in independent experiments with two different HMLER cell populations (HMLER_1, HMLER_2). The CD44/CD24 FACS profiles are shown for a subset of HMLER_2 compound treatments with the green ellipse (formula image) denoting the CSC-enriched fraction and the blue ellipse (formula image
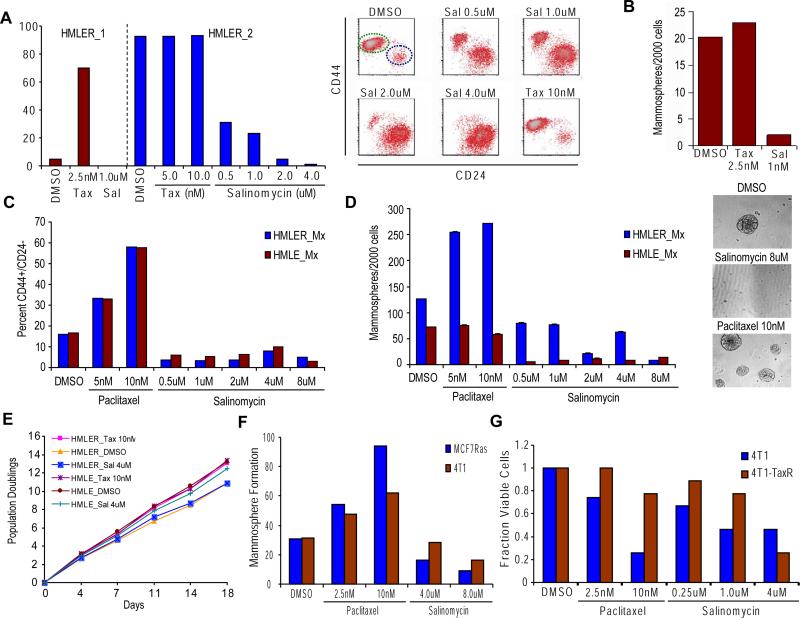
) the CSC-depleted fraction. (b) Quantification of tumorsphere-formation with HMLER cells treated as in (a). (c) Heterogeneous populations (control/EMT mixtures) of HMLE and HMLER cells (HMLE_Mx, HMLER_Mx, respectively) were compound-treated for 4 days, cultured in the absence of compound for 4 days, and the percent of CD44high/CD24low cells quantified by FACS. (d) Quantification of mammosphere-formation in HMLE_Mx and HMLER_Mx populations compound-treated as in (a). Phase-contrast images of mammospheres are shown. (e) In vitro growth curves of HMLER cells compound-treated as in (a) are shown. (f) Compound-pretreated MCF7Ras (4000 cells/well) and 4T1 cells (1000 cells/well) were seeded in the absence of compound and tumorsphere formation assessed at 10 days. (g) The fraction of viable cells after compound treatment was assessed using trypan-blue exclusion for both the parental 4T1 line and a paclitaxel-resistant 4T1 line (4T1-TaxR).
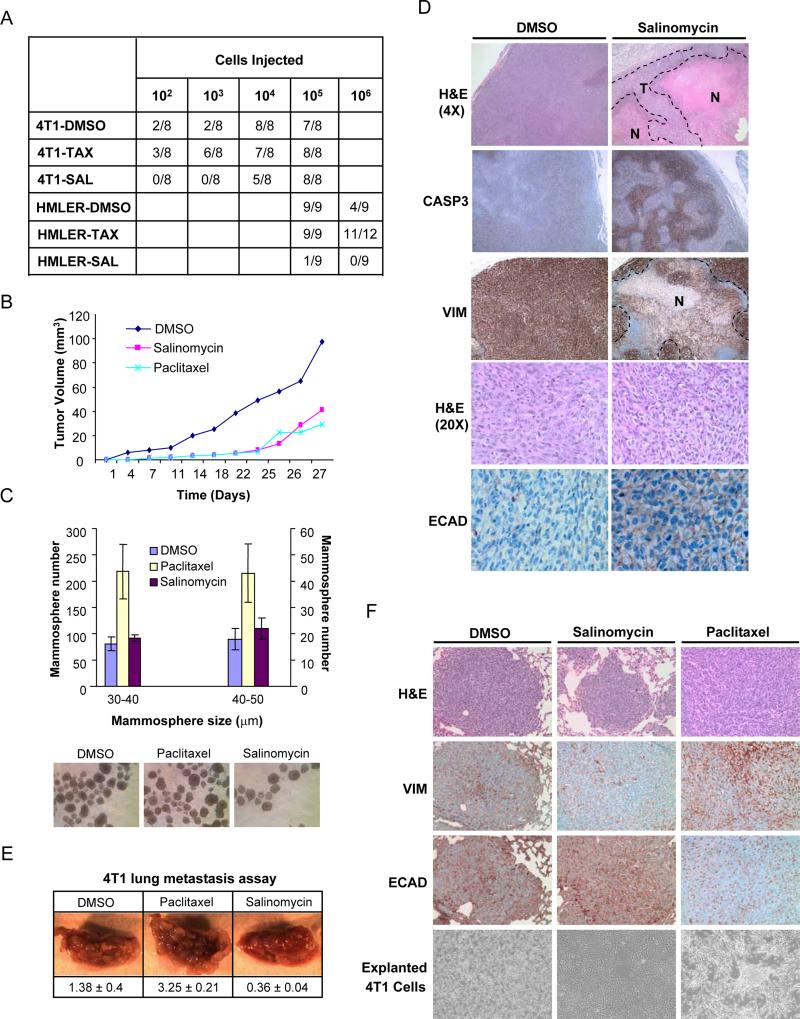
Figure 5
Figure 5. Effects of salinomycin and paclitaxel treatment on tumor seeding, growth and metastasis in vivo
(a) Tumor-seeding ability of HMLER and 4T1 breast cancer cells treated with salinomycin, paclitaxel or DMSO. (b) SUM159 tumor-growth curves of compound-treated mice. (c) Quantification of tumorsphere-forming potential (diameter between 20-50μm was evaluated) of cancer cells isolated from dissociated SUM159 tumors from compound-treated mice. Images of tumorsphere cultures are shown. (d) Histological analysis of tumors from salinomycin- or vehicle-treated mice. Shown are H&E, caspase-3, human-specific vimentin and E-cadherin staining. (e) Tail-vein injection of 4T1 cancer cells, pre-treated with paclitaxel, salinomycin, or DMSO. Lung images shown were captured at 1.5X magnification. Values are shown below the images as the mean and standard error for lung burden in each treatment group. (f) H&E, vimentin and E-cadherin staining of lung nodules from compound-treated 4T1 breast cancer cells. Also shown are images of cultured 4T1 cells explanted from lung nodules.
Figure 6
Figure 6. Salinomycin and paclitaxel treatment affect expression of CSC genes associated with poor patient prognosis
HMLER cells were treated in triplicate with either salinomycin or paclitaxel and then subjected to microarray gene expression analysis. (a) Genes showing differential expression (|t-statistic| > 5) between salinomycin (Sal) and paclitaxel (Tax) treatment conditions were plotted on the Heatmap using the Euclidean distance measure. (b,c,d) Salinomycin treatment reduces the expression of clinically relevant breast CSC and progenitor genes. Gene set enrichment analysis was used to determine whether the previously reported (b) CD44+CD24− IGS (Liu et al., 2007), (c) CD44+CD24− (Shipitsin et al., 2007) or (d) Mammosphere (Dontu et al., 2003) gene sets were repressed in response to salinomycin in comparison with paclitaxel treatment. Graphed are the Kolmogorov-Smirnov enrichment scores versus Gene ranks based on differential expression. P-values reflecting statistical significance for each analysis are shown. The rank of each gene in the gene set relative to the differential expression between salinomycin and paclitaxel treatment are shown as horizontal lines in the vertical bars next to each graph.

Comment in

References

    1. Al-Hajj M, Wicha MS, Benito-Hernandez A, Morrison SJ, Clarke MF. Prospective identification of tumorigenic breast cancer cells. PNAS. 2003;100:3983–3988. - PMC - PubMed
    1. Bao S, Wu Q, McLendon RE, Hao Y, Shi Q, Hjelmeland AB, Dewhirst MW, Bigner DD, Rich JN. Glioma stem cells promote radioresistance by preferential activation of the DNA damage response. Nature. 2006;444:756–760. - PubMed
    1. Croker AK, Allan AL. Cancer stem cells: implications for the progression and treatment of metastatic disease. J Cell Mol Med. 2008;12:374–390. - PMC - PubMed
    1. Dean M, Fojo T, Bates S. Tumour stem cells and drug resistance. Nature Rev Cancer. 2005;5:275–284. - PubMed
    1. Diehn M, Cho RW, Lobo NA, Kalisky T, Dorie MJ, Kulp AN, Qian D, Lam JS, Ailles LE, Wong M, et al. Association of reactive oxygen species levels and radioresistance in cancer stem cells. Nature. 2009 - PMC - PubMed

Publication types

MeSH terms

Associated data