. 2009 Oct 15;490(2):85-95.
doi: 10.1016/j.abb.2009.07.027. Epub 2009 Aug 13.

Transcriptional regulation of mitochondrial glycerophosphate acyltransferase is mediated by distal promoter via ChREBP and SREBP-1

Affiliations

Transcriptional regulation of mitochondrial glycerophosphate acyltransferase is mediated by distal promoter via ChREBP and SREBP-1

Prajna Guha et al. Arch Biochem Biophys. .

Abstract

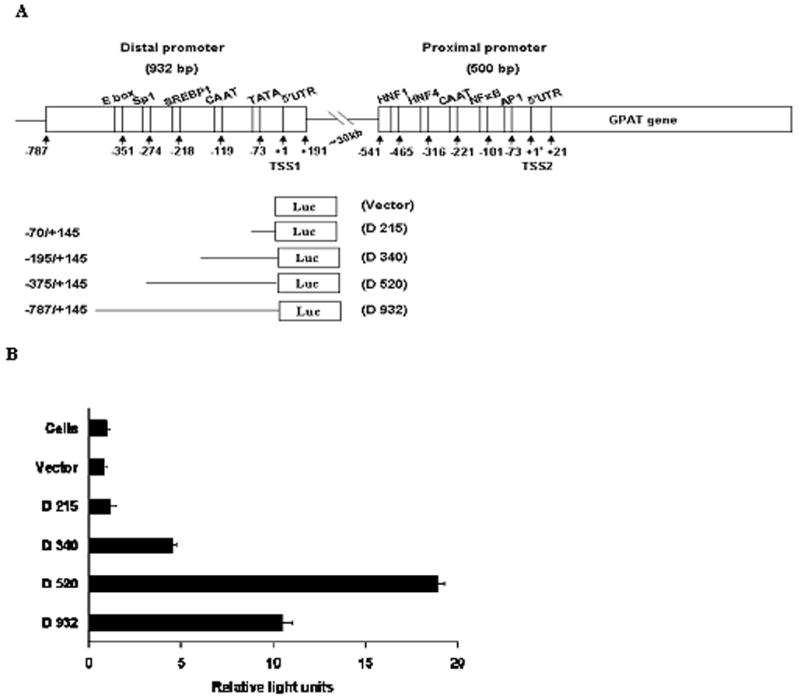
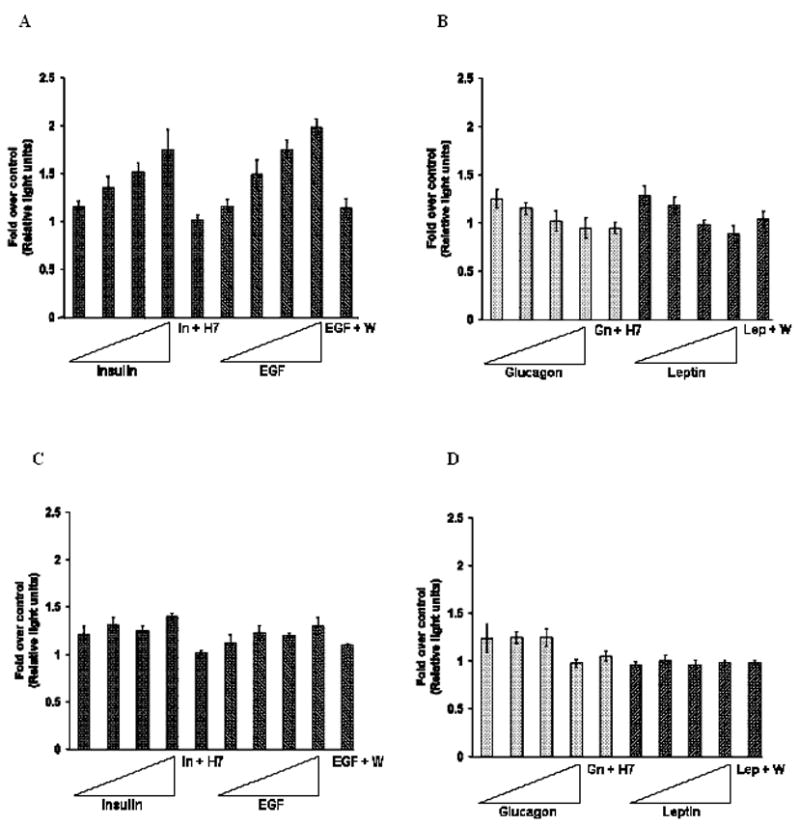
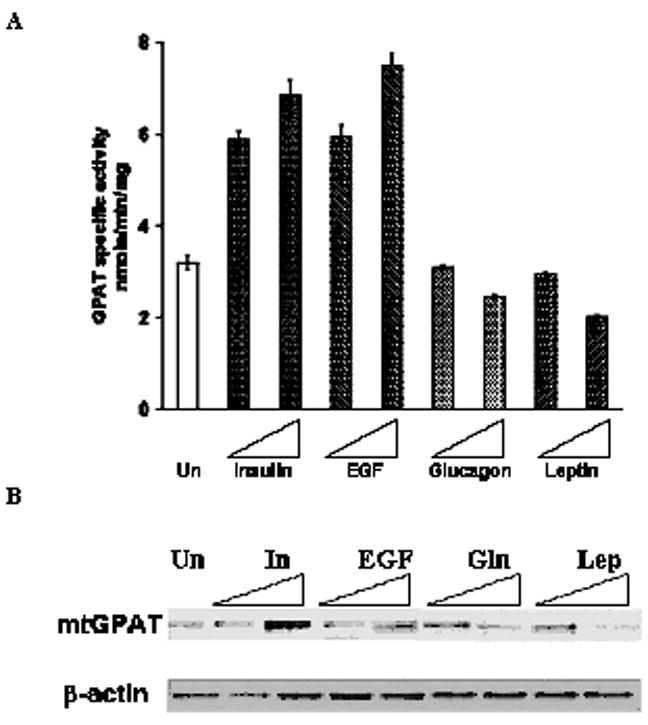
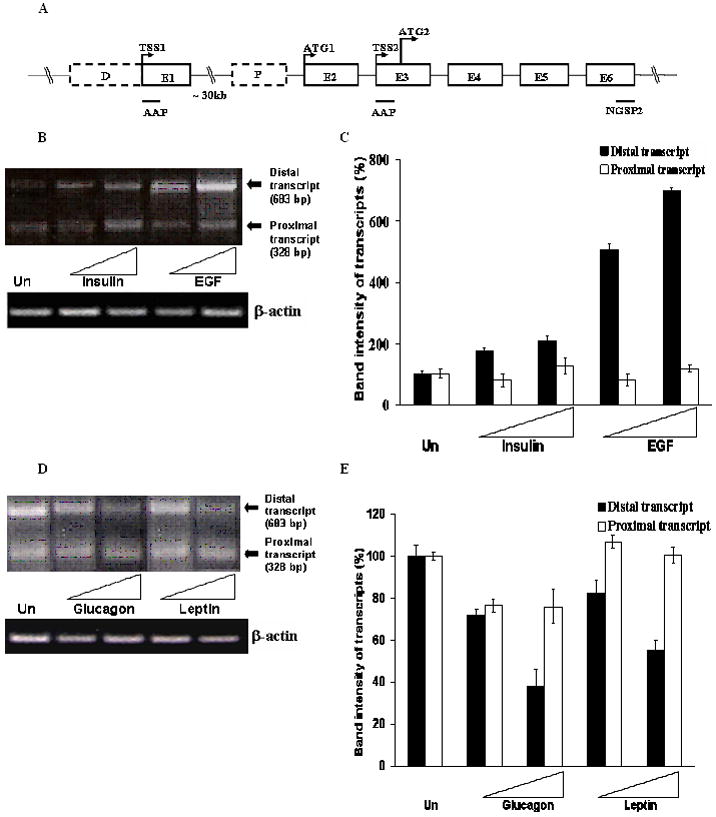
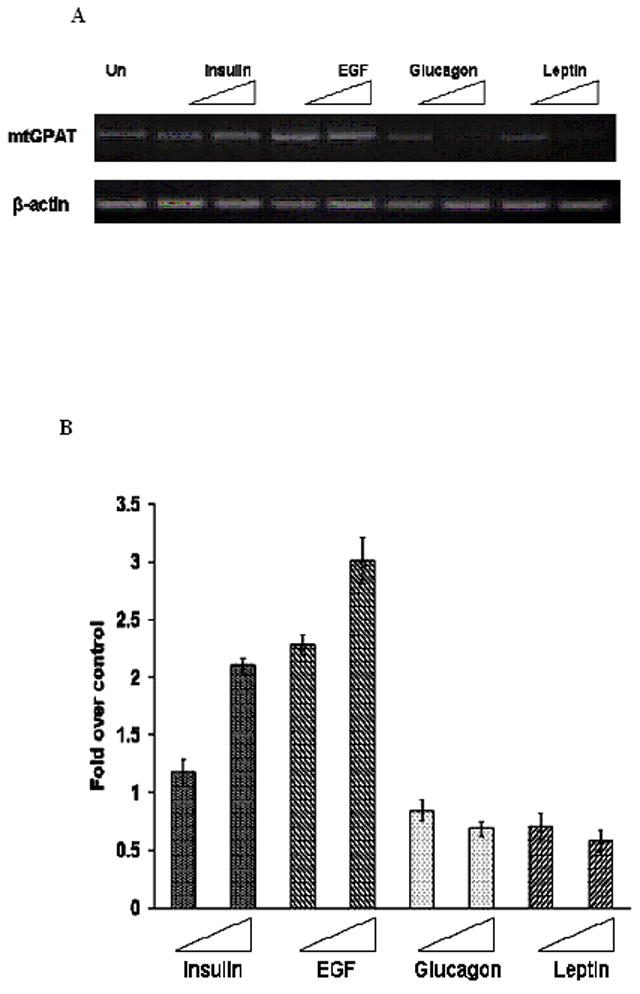
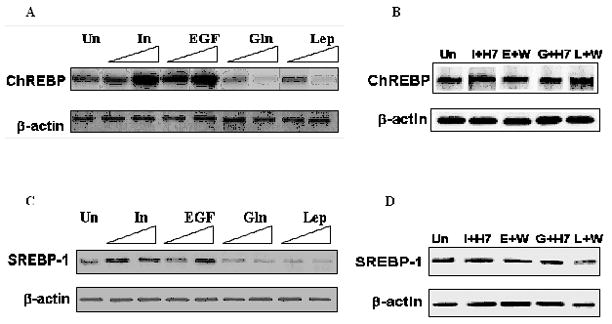
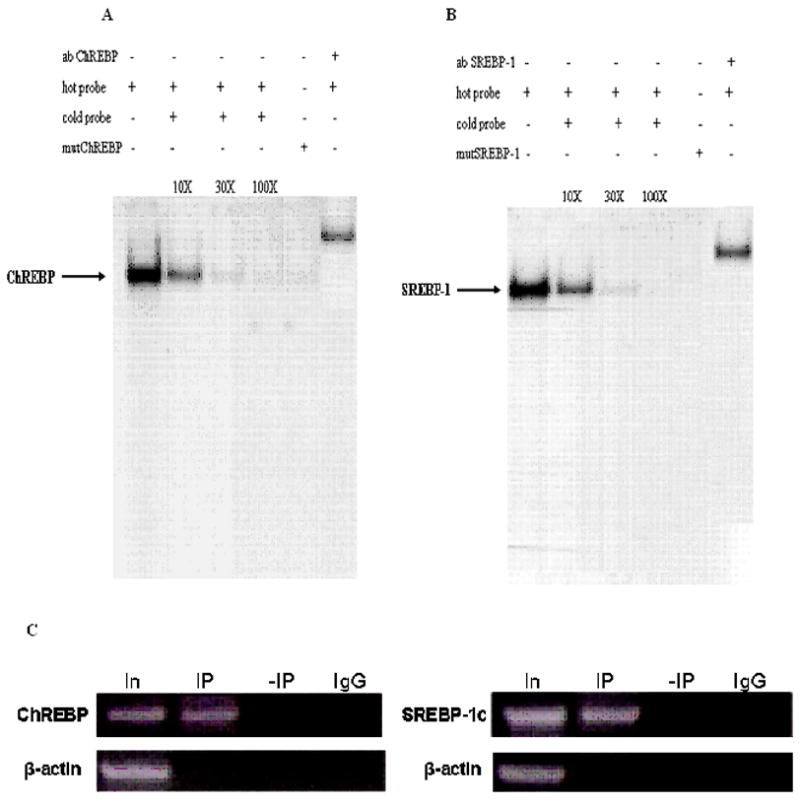
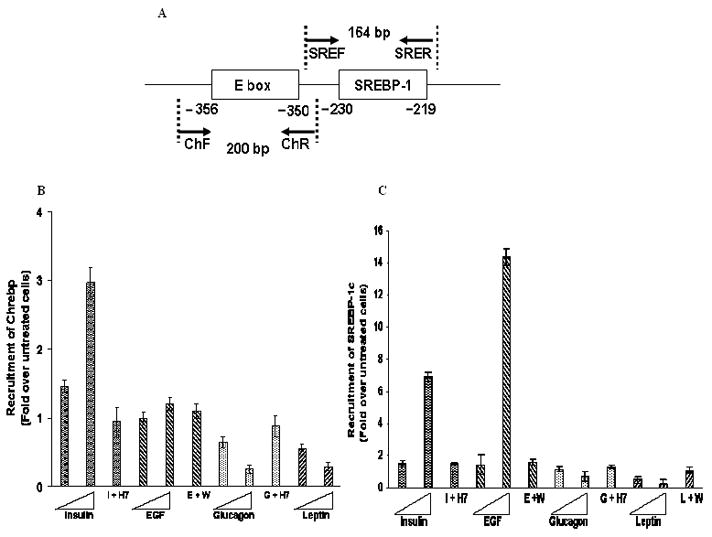
We have recently identified two promoters, distal and proximal for rat mitochondrial glycerophosphate acyltransferase (mtGPAT). Here we are reporting further characterization of the promoters. Insulin and epidermal growth factor (EGF) stimulated while leptin and glucagon inhibited the luciferase activity of the distal promoter and the amounts of the distal transcript. Conversely, luciferase activity of the proximal promoter and proximal transcript remained unchanged due to these treatments. Only the distal promoter has binding sites for carbohydrate response element binding protein (ChREBP) and sterol regulatory element binding protein-1 (SREBP-1). Electromobility shift assays and chromatin immunoprecipitation assays demonstrated that ChREBP and SREBP-1 bind to the mtGPAT distal promoter. Insulin and EGF increased while glucagon and leptin decreased the binding of SREBP-1 and ChREBP to the distal promoter. Thus, the distal promoter is the regulatory promoter while the proximal promoter acts constitutively for rat mtGPAT gene under the influence of hormones and growth factor.


Figures

Fig. 1
Fig. 1. Deletion analysis of rat mtGPAT distal promoter by using Luciferase reporter gene constructs
A. Schematic presentation of the distal and proximal promoters. TSS1 is represented as +1 and TSS2 as +1*. The distal promoter is ~30kb upstream of the proximal promoter region. Transcription factor binding sites, TATA box, inverted CAAT box and 5′UTR of both the distal and the proximal promoters relative to their individual TSSs are shown. Luciferase constructs of the distal promoter are shown with the numbers indicating the number of nucleotides upstream of TSS1. B. Cells were cotransfected with serial deletion constructs and pRLTK (internal control) or with the promoterless vector (pGL3-basic) and pRLTK. Luciferase activity was measured 24 hours post-transfection. Promoter activity is expressed in relative light units. Results are the averages of three independent experiments performed in triplicates ± S.E.
Fig. 2
Fig. 2. Effect of the hormones and EGF on the luciferase activity of distal and proximal promoters
A, B.Plasmid D 520 was cotransfected with pRLTK (internal control) into cells and treated with increasing concentrations (1 nM–1000 nM) of insulin, EGF, glucagon or leptin for 24 hours. Luciferase assay of cells treated with 20 μM Wortmannin (W) or 50 μM of H7 for 2 hours followed by treatment with 100 nM of EGF, leptin, insulin or glucagon for 24 hours are denoted as E+W, L+W, I+H7 and Gn+H7, respectively. Results are expressed as fold over the luciferase activity of the untreated cells’ (control). The results are the averages of three independent experiments performed in triplicates ± S.E. C, D. Plasmid Proximal 500 was cotransfected with pRLTK (internal control) into cells. Cells were treated or untreated with increasing concentrations (1nM–1000 nM) of insulin, EGF, glucagon or leptin for 24 hours. Luciferase assay of cells treated with 20 μM Wortmannin (W) or 50 μM of H7 for 2 hours followed by treatment with 100 nM of EGF, leptin, insulin or glucagon for 24 hours are denoted as E+W, L+W, I+H7 and Gn+H7, respectively. Results are expressed as fold over the luciferase activity of the untreated cells’ (control). The results are the averages of three independent experiments performed in triplicates ± S.E.
Fig. 3
Fig. 3. Effect of the four agents on mtGPAT protein expression and specific activity
A. GPAT specific activity (nmole/min/mg) was measured for mitochondria isolated from the untreated cells and cells treated cells as described in “Materials and Methods”. Results are average of three independent experiments performed in triplicates. Error bars indicate ± S.E. B. Whole mitochondria (5μg) were subjected to 10% SDS-PAGE and immunoprecipitated with IM1GAT antibody. Equal amount of loading was confirmed by stripping the membrane and reprobing with β-actin antibody.
Fig. 4
Fig. 4. Effect of the agents on the distal and proximal promoter transcript of mtGPAT gene
A. Schematic presentation of the genomic region of mtGPAT gene with the arrangement of exons and introns and their respective sizes. Dotted boxes indicate promoters (D –distal promoter, P – proximal promoter), solid boxes indicate exons and lines indicate the introns. B, D. Total RNA, 2 μg from cells treated with insulin and EGF (stimulators) and 4 μg from cells treated with glucagon and leptin (inhibitors), was used to synthesize the first strand cDNA. PCR was performed for 40 cycles and the products were run on 1.5% agarose gel. Upper band is from the distal promoter transcript while the lower band is from the proximal promoter transcript. β-actin was used as a loading control. C, E. Densitometric analysis of the band intensities. Black bars and white bars represent average values obtained from the densitometric analysis of the distal and proximal products obtained from four different experiments. Error bars indicate ± S.E. The intensities of each band in the top panel were normalized to the intensity of the corresponding actin band for each lane in the bottom panel to correct for differences in loading. The values are expressed as a percentage of the band intensities of the untreated cells.
Fig. 5
Fig. 5. Effect of 100 nM and 1000 nM of each of the agents on distal transcript of rat mtGPAT gene
Cells were treated with either 100 nM or 1000 nM of each of insulin, EGF, glucagon or leptin. A. After 24 hours of treatment, total RNA was isolated and distal transcript (683 bp) and β-actin (120 bp) mRNA expression levels were analyzed by semiquantitative RT-PCR as described under “Materials and Methods”. The RT-PCR products were electrophoresed in 2% agarose gel. B. Quantification of distal promoter transcript by real-time PCR in untreated and treated cells. To correct for variations in input RNA, the data were normalized using β-actin. Data are represented as fold over control (untreated cells) mRNA levels as determined by ΔΔCt method. Data are represented as the average of four different experiments ± S.E.
Fig. 6
Fig. 6. Protein levels of ChREBP and SREBP-1 in the nucleus of the treated cells
A, C Nuclear extracts from cells treated with 100 nM or 1000 nM of the agents were used to perform Western blotting to detect the amount of ChREBP and SREBP-1 available for binding to the promoter. B, D. Nuclear extracts from cells pretreated with H7 or wortmannin (W) for 2 hours followed by treatment with 100 nM of the respective four agents viz. insulin (I), EGF (E), glucagon (G) and leptin (L) as explained in “Materials and Methods” were used to perform Western blotting to detect the amount of ChREBP and SREBP-1.
Fig. 7
Fig. 7. Electromobility shift assay for SREBP-1c and ChREBP binding to distal promoter
EMSAs were performed using radiolabeled oligonucleotide as mentioned in “Materials and Methods” for either the distal promoter containing the ChREBP (hot probe) binding site (A) or the SREBP-1 (hot probe) binding site (B), and nuclear extracts from untreated cells. The arrows denote the migration of SREBP-1 or ChREBP complex. Specificity of binding of ChREBP and SREBP-1c is demonstrated by competition by the respective non-radiolabeled probes (cold probe) added in excess (30 M) and the failure of the radiolabeled mutated probes to bind with the respective transcription factors. Competition assay was performed in the absence or presence of the indicated molar excess of unlabeled oligonucleotides. Supershift assay performed with the respective antibodies completely abolished the migration of the respective complexes. C. Chromatin immunoprecipitation of distal promoter region for binding of ChREBP and SREBP-1 to their respective binding sites. Input DNA or DNA immunoprecipitated with ChREBP or SREBP-1 antibodies or IgG were amplified as explained in “Materials and Methods”. In, input DNA; IP, immunoprecipitated DNA;-IP, no immunoprecipitation; IgG, immunoprecipitated with normal rabbit IgG.
Fig. 8
Fig. 8. Chromatin Immunoprecipitation analysis of ChREBP and SREBP-1c binding to the mtGPAT distal promoter
A. Schematic presentation of the putative ChREBP and SREBP-1c binding sites in the distal promoter region and the primers used for the ChREBP and SREBP-1c. The numbers represent the distance in nucleotides from the TSS1. B, C. Cells were treated with 100 nM or 1000 nM of insulin, EGF, glucagon or leptin for 24 hours. DNA binding proteins were crosslinked with formaldelhyde and chromatin was sonicated. Immunoprecipitation was performed using either specific antibodies such as ChREBP/SREBP-1 or with non specific antibody (normal rabbit serum). After reversing the cross links, immunoprecipitated DNA was isolated and analyzed. The primers that amplified 164 bp and 200 bp flanking the SREBP-1 and ChREBP binding sites in the distal promoter were used. Data represent the average of at least 9 determinations ± S.D., and are presented as fold-differences relative to control conditions (untreated cells).

Similar articles

Cited by

References

    1. Haldar D, Kelker HC, Pullman ME. Properties of acyl coenzyme A: 1-acyl-sn-glycerol 3-phosphate acyltransferase from rat liver mitochondria and microsomes. Trans N Y Acad Sci. 1983;41:173–182. - PubMed
    1. Linden D, William-Olsson L, Rhedin M, Asztely AK, Clapham JC, Schreyer S. Overexpression of mitochondrial GPAT in rat hepatocytes leads to decreased fatty acid oxidation and increased glycerolipid biosynthesis. J Lipid Res. 2004;45:1279–1288. - PubMed
    1. Onorato TM, Chakraborty S, Balija VS, Haldar D. In: LIPIDS: Glycerolipid Metabolizing Enzymes. Haldar D, Das SK, editors. Research Signpost; Trivandrum: 2002.
    1. Hammond LE, Gallagher PA, Wang S, Hiller S, Kluckman KD, Posey-Marcos EL, Maeda N, Coleman RA. Mitochondrial glycerol-3-phosphate acyltransferase-deficient mice have reduced weight and liver triacylglycerol content and altered glycerolipid fatty acid composition. Mol Cell Biol. 2002;22:8204–8214. - PMC - PubMed
    1. Lindén D, William-Olsson L, Ahnmark A, Ekroos K, Hallberg C, Sjögren HP, Becker B, Svensson L, Clapham JC, Oscarsson J, Schreyer S. Liver-directed overexpression of mitochondrial glycerol-3-phosphate acyltransferase results in hepatic steatosis, increased triacylglycerol secretion and reduced fatty acid oxidation. FASEB J. 2006;20:434–443. - PubMed

Publication types

MeSH terms