. 2009 Aug 15;23(16):1929-43.
doi: 10.1101/gad.532109.

Characterization of the rapamycin-sensitive phosphoproteome reveals that Sch9 is a central coordinator of protein synthesis

Affiliations

Characterization of the rapamycin-sensitive phosphoproteome reveals that Sch9 is a central coordinator of protein synthesis

Alexandre Huber et al. Genes Dev. .

Abstract

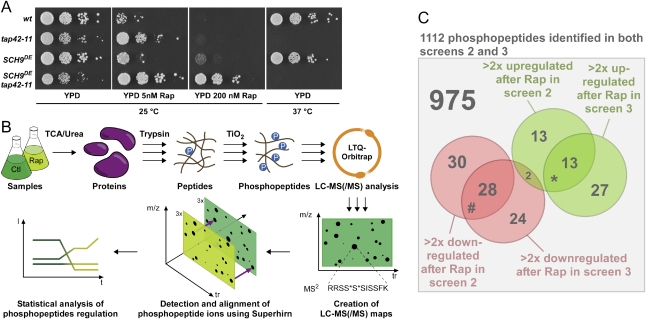
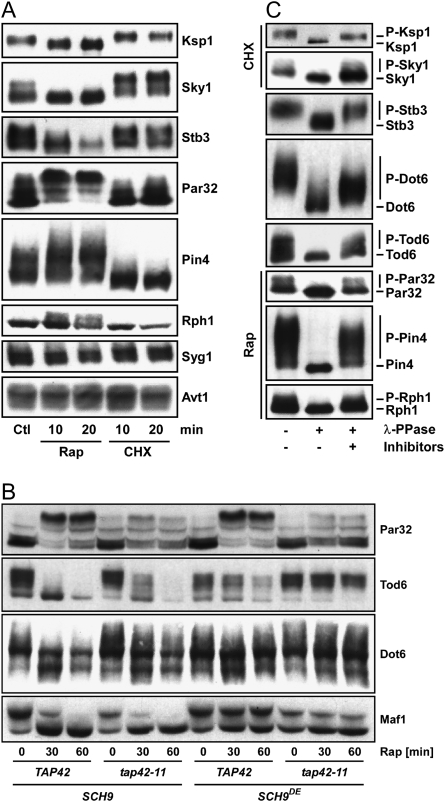
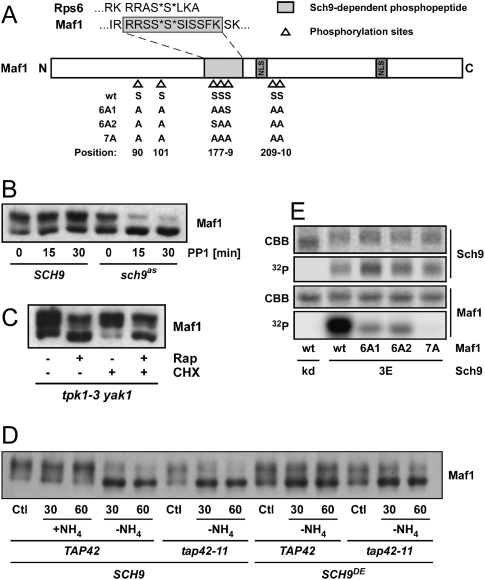
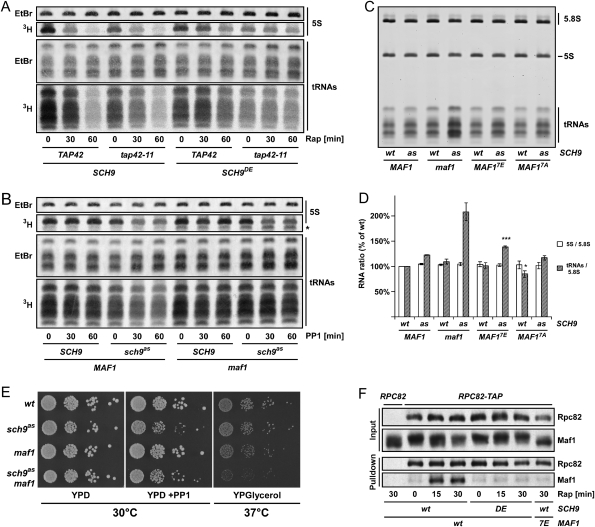
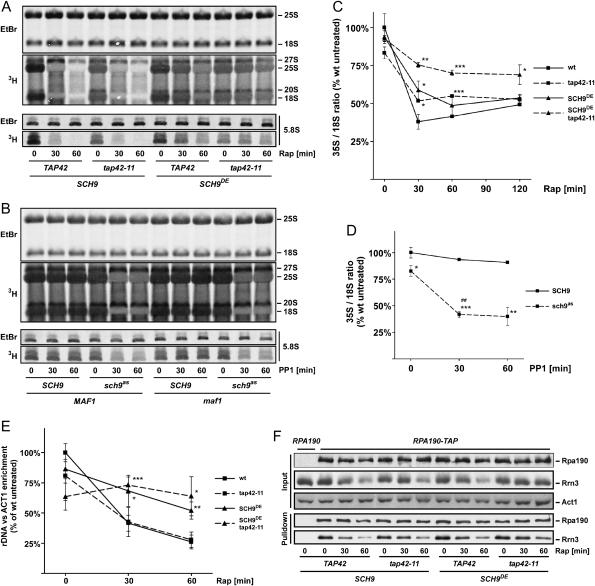
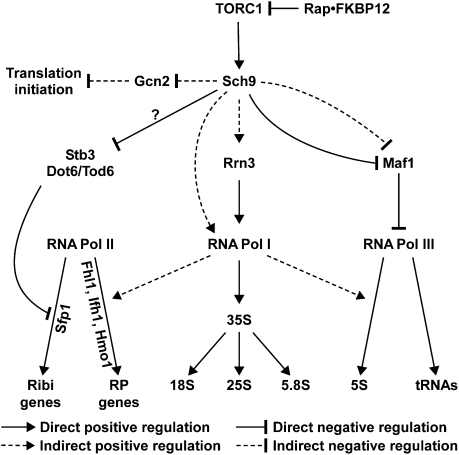
The target of rapamycin complex 1 (TORC1) is an essential multiprotein complex conserved from yeast to humans. Under favorable growth conditions, and in the absence of the macrolide rapamycin, TORC1 is active, and influences virtually all aspects of cell growth. Although two direct effectors of yeast TORC1 have been reported (Tap42, a regulator of PP2A phosphatases and Sch9, an AGC family kinase), the signaling pathways that couple TORC1 to its distal effectors were not well understood. To elucidate these pathways we developed and employed a quantitative, label-free mass spectrometry approach. Analyses of the rapamycin-sensitive phosphoproteomes in various genetic backgrounds revealed both documented and novel TORC1 effectors and allowed us to partition phosphorylation events between Tap42 and Sch9. Follow-up detailed characterization shows that Sch9 regulates RNA polymerases I and III, the latter via Maf1, in addition to translation initiation and the expression of ribosomal protein and ribosome biogenesis genes. This demonstrates that Sch9 is a master regulator of protein synthesis.


Figures

Figure 1.
Figure 1.
Label-free quantitative phosphoproteomic screens. (A) TAP42 and SCH9 act in parallel downstream from TORC1. Ten-fold serial dilutions of sch9 tap42 cells complemented with indicated alleles of SCH9 and TAP42 and made prototroph with pAH149 were spotted onto the indicated media and incubated for 2–5 d at 25°C or 37°C. (Rap) Rapamycin. (B) Strategy for label-free quantitative phosphoproteomics. Triple arrows indicate steps performed in triplicate. (C) Venn diagram of phosphopeptides identified in both screens 2 and 3. Subsets of phosphopeptides found to be up-/down-regulated by rapamycin in each screen and their overlaps are shown. The overlap of phosphopeptides predicted to be down-regulated in screen 3 and up-regulated in screen 2 is not statistically significant (P = 0.25). P-values associated with the overlaps enrichment. (*) P < 10−12; (#) P < 10−24.
Figure 2.
Figure 2.
New TORC1 effectors. (A) Migration shift assays of proteins identified in the phosphoproteomic screens. Yeast cells expressing HA-tagged Ksp1, Sky1, Stb3, Par32, Pin4, Rph1, Syg1, and Avt1 were grown in YPD and treated with rapamycin or cycloheximide (CHX). Proteins were extracted under denaturing conditions and their SDS-PAGE migration was assayed by Western blotting. (B) Migration shift assays of phosphoproteins found to be regulated by SCH9 or TAP42. Reporter plasmids expressing HA-tagged Par32, Tod6, Dot6, or Maf1 were transformed into cells of the indicated genotype. Cells were grown in YPD treated as indicated with rapamycin and assayed as in A. (C) Wild-type cells expressing HA-tagged Ksp1, Sky1, Stb3, Dot6, Tod6, Par32, Pin4, or Rph1 were grown in YPD and treated 15 min with rapamycin or cycloheximide where indicated. Proteins were extracted under native conditions and HA immunoprecipitates were incubated with λ phosphatase in the presence or absence of phosphatase inhibitors.
Figure 3.
Figure 3.
TORC1 regulates Maf1 phosphorylation via SCH9, independently of PKA. (A) Maf1 schematic. Maf1 features including phosphorylation sites and NLSs are pictured. Serines predicted to be phosphorylated in the MS data are followed by asterisks as are the Sch9 target residues in the C terminus of Rps6. The various alanine-substituted versions of Maf1 used in the kinase assays shown in D are summarized below the scheme. (B) Sch9 inhibition leads to Maf1 dephosphorylation. (C) TORC1 regulates Maf1 phosphorylation independently of PKA. (B,C) Protein extracts were prepared from cells of the indicated genotype following treatment (15 min in C) with the indicated drugs (PP1: 1NM-PP1). Phosphorylation of Maf1-3HA was determined by SDS-PAGE and Western blotting. (D) Sch9 couples nitrogen-dependent signals to Maf1. Prototroph cells of the indicated genotype were grown to exponential phase in SD, filtered, and resuspended in control (+NH4) or in ammonium-deprived medium (−NH4). Samples were taken at the indicated time points and analyzed for Maf1 phosphorylation by Western blotting. (E) Sch9 phosphorylates 7 serines in Maf1 in vitro. Maf1 mutants, purified from Escherichia coli, were tested as substrates for GST-Sch93E purified from yeast. GST-Sch9kd is a point mutant lacking catalytic activity and was used as a negative control. Reactions were resolved by SDS-PAGE, proteins were stained with Coomassie (CBB) and the dried gel was analyzed for 32P incorporation.
Figure 4.
Figure 4.
TORC1 regulates RNA Pol III via Sch9 and Maf1. (A) Rapamycin inhibits 5S rRNA and tRNA synthesis via SCH9. (B) Sch9 inhibition leads to a Maf1-dependent inhibition of tRNA synthesis. (A,B) RNA synthesis in cells of the indicated genotype following the indicated drug treatment was determined by metabolic labeling with 3H-uracil. Total RNA loaded was determined by staining with ethidium bromide (EtBr). Asterisk (*) indicates an unstable RNA species that accumulates in maf1 cells. (C) MAF1 phosphorylation regulates tRNA levels. Cells of the indicated genotype were grown in SC −URA −LEU −TRP −HIS 0.2% Gln 300 nM 1NM-PP1 to log phase (OD600 < 0.8) and total RNA was extracted. Total levels of the 5S and 5.8S rRNA and tRNA were assayed by PAGE and EtBr staining. (D) Quantification of C and two other independent experiments. 5S:5.8S and tRNA:5.8S ratios were calculated and plotted relative to untreated wild-type control. (*) P < 0.05; (***) P < 0.001 versus wild-type control. (E) Genetic interactions between SCH9 and MAF1. Ten-fold dilutions of the indicated strains were spotted and grown on YPD ± 1NM-PP1 (2 d, 30°C) or on YPGlycerol (4 d, 37°C). (F) Sch9 regulates Maf1 association with RNA Pol III. Interaction of Maf1-3HA with RNA Pol III was assessed by Rpc82-TAP pull-downs followed by SDS-PAGE and Western blotting. Relevant genotypes and rapamycin treatments are indicated.
Figure 5.
Figure 5.
TORC1 regulates RNA Pol I via Sch9. (A) Rapamycin treatment decreases the processing/expression of RNA pol I-derived rRNA species. (B) Sch9 inhibition decreases the processing/expression of RNA pol I-derived rRNA species. (A,B) Synthesis/processing of rRNA was assayed by metabolic labeling with 3H-uracil. Total RNA loaded was determined by staining with ethidium bromide (EtBr). (C) Rapamycin treatment decreases 35S pre-rRNA synthesis. (D) Sch9 inhibition decreases 35S pre-rRNA synthesis. (C,D) 35S and 18S rRNA levels were determined by primer extension—gels are shown in Figure S9—and their ratios were plotted. Values are means of three independent experiments ± SD. (E) RNA Pol I recruitment at the rDNA locus depends on Sch9. Association of RPA190-13myc with the rDNA locus was determined by ChIP. Values are means of four independent experiments ± SD. Statistical confidences for CE: (*) P < 0.05; (**) P < 0.01; (***) P < 0.001 versus wild-type control; (##) P < 0.01 versus untreated isogenic control. (F) Sch9 does not regulate Rrn3–RNA Pol I interaction. Association of Rrn3-5HA with Rpa190-TAP was assayed using TAP pull-downs and SDS-PAGE/Western blotting. (A–F) Relevant genotypes and rapamycin/1NM-PP1 treatment times are indicated.
Figure 6.
Figure 6.
Model of TORC1 signaling highlighting the central role that Sch9 plays in coordinating the expression, assembly and activity of the protein synthesis machinery. See the Discussion for details.

References

    1. Badis G, Chan ET, van Bakel H, Pena-Castillo L, Tillo D, Tsui K, Carlson CD, Gossett AJ, Hasinoff MJ, Warren CL, et al. A library of yeast transcription factor motifs reveals a widespread function for Rsc3 in targeting nucleosome exclusion at promoters. Mol Cell. 2008;32:878–887. - PMC - PubMed
    1. Beck T, Hall MN. The TOR signalling pathway controls nuclear localization of nutrient-regulated transcription factors. Nature. 1999;402:689–692. - PubMed
    1. Beugnet A, Tee AR, Taylor PM, Proud CG. Regulation of targets of mTOR (mammalian target of rapamycin) signalling by intracellular amino acid availability. Biochem J. 2003;372:555–566. - PMC - PubMed
    1. Bharucha N, Ma J, Dobry CJ, Lawson SK, Yang Z, Kumar A. Analysis of the yeast kinome reveals a network of regulated protein localization during filamentous growth. Mol Biol Cell. 2008;19:2708–2717. - PMC - PubMed
    1. Bodenmiller B, Malmstrom J, Gerrits B, Campbell D, Lam H, Schmidt A, Rinner O, Mueller LN, Shannon PT, Pedrioli PG, et al. PhosphoPep–a phosphoproteome resource for systems biology research in Drosophila Kc167 cells. Mol Syst Biol. 2007a;3:139. - PMC - PubMed

Publication types

MeSH terms