. 2009 Sep;12(9):1136-44.
doi: 10.1038/nn.2376. Epub 2009 Aug 16.

Origins of correlated activity in an olfactory circuit

Affiliations

Origins of correlated activity in an olfactory circuit

Hokto Kazama et al. Nat Neurosci. 2009 Sep.

Abstract

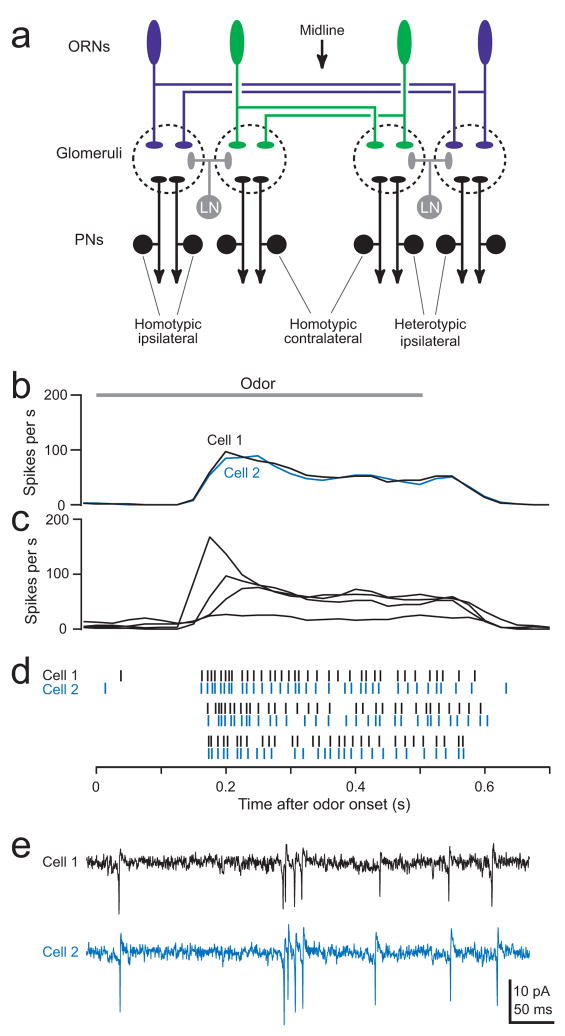
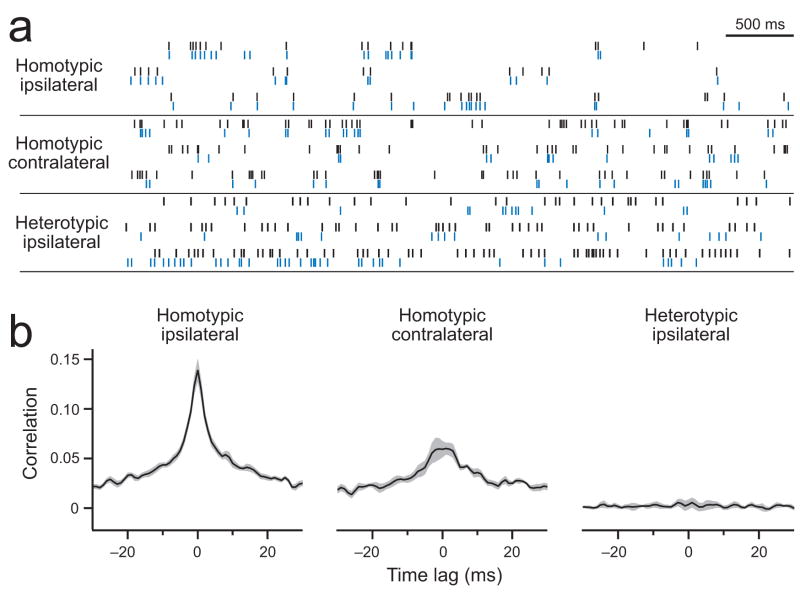
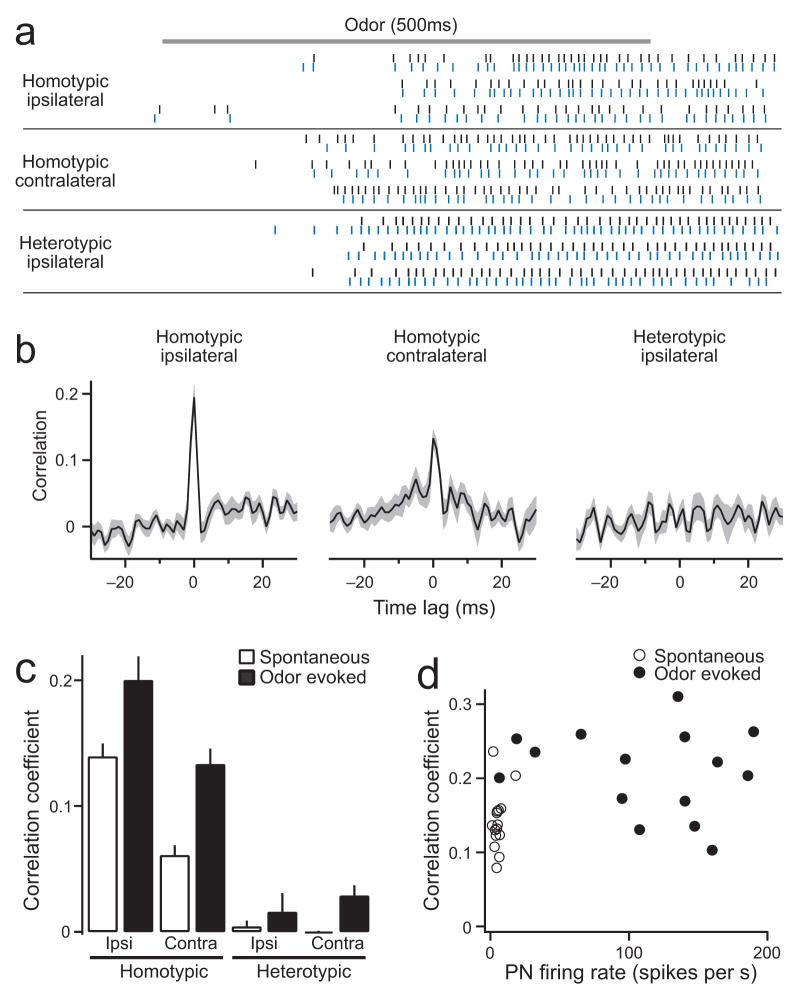
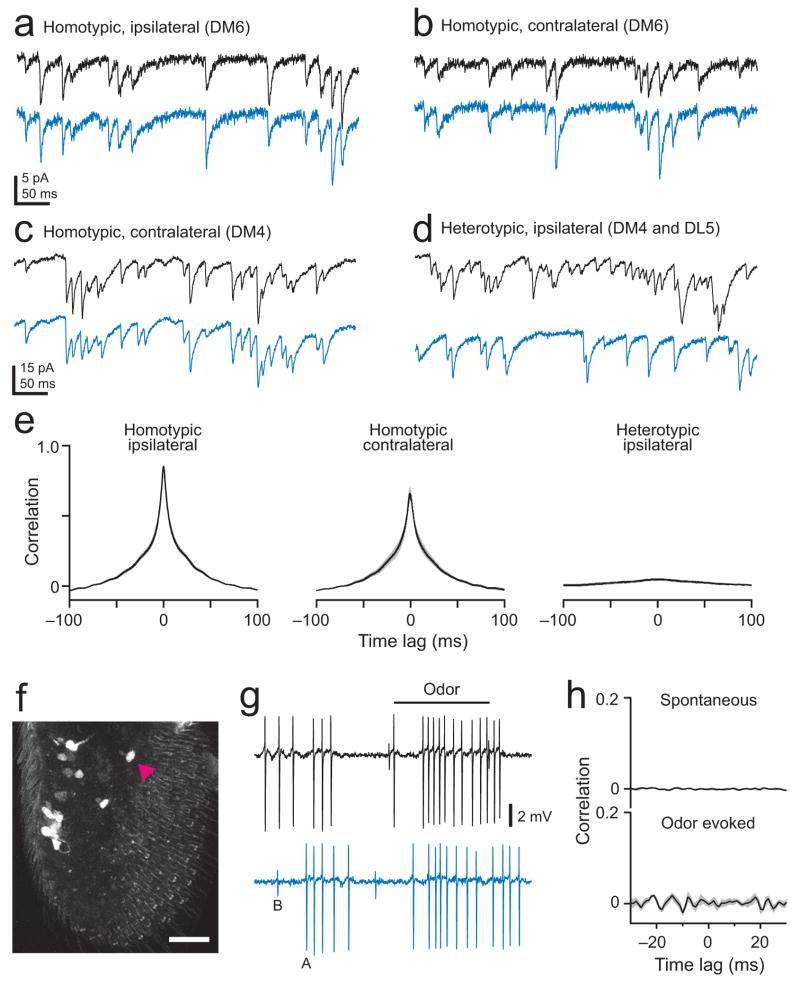
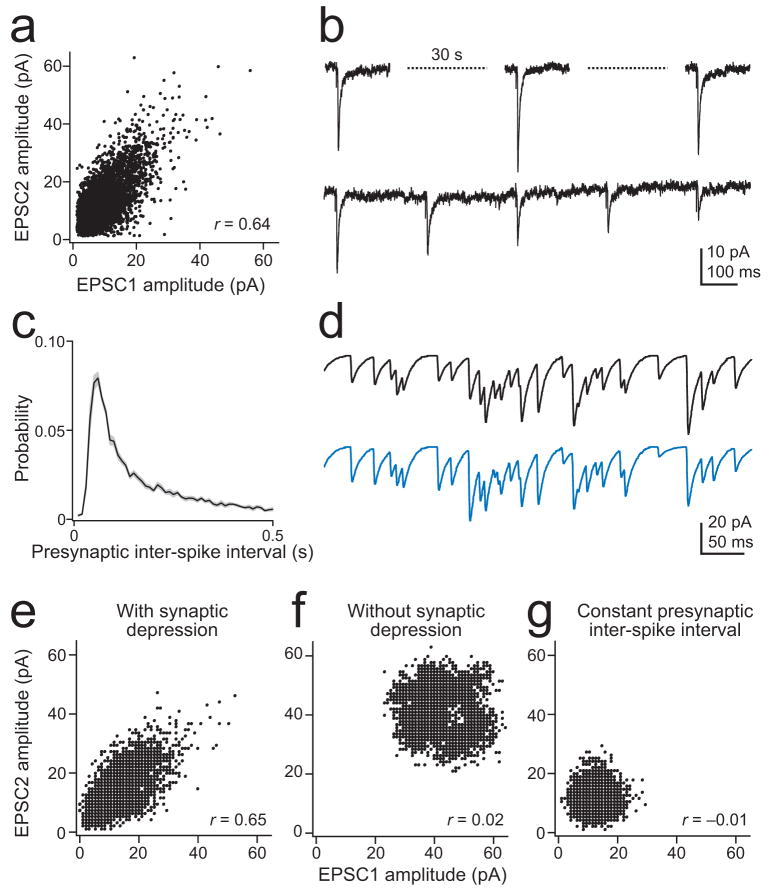
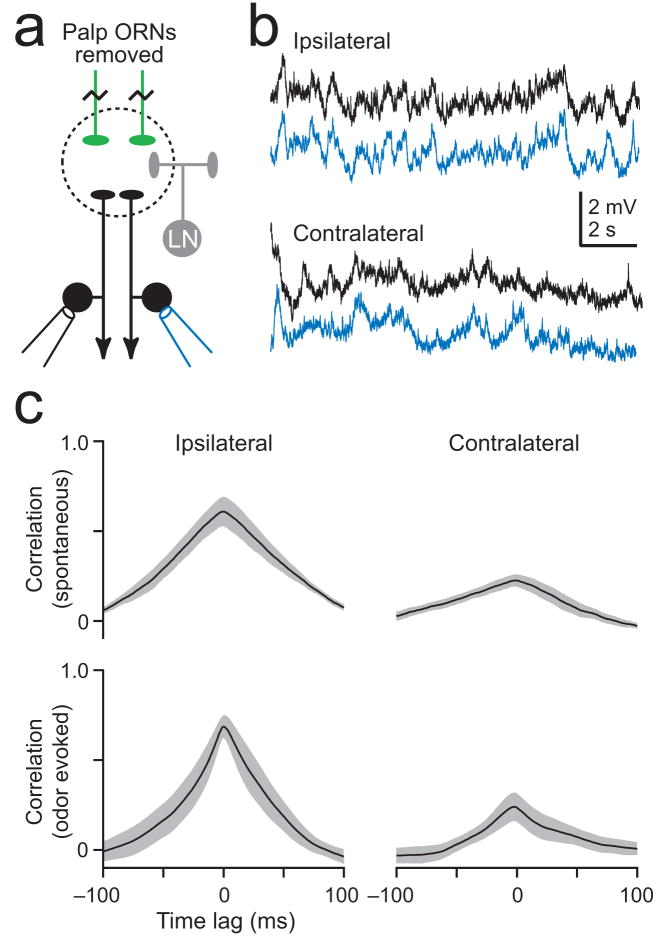
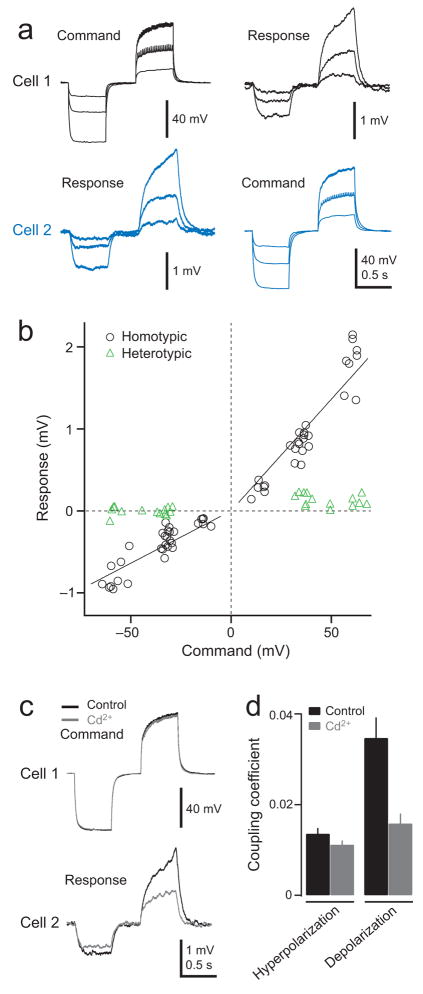
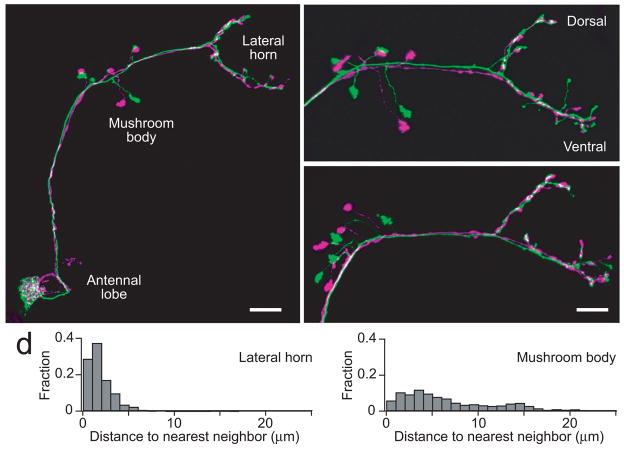
Multineuronal recordings often reveal synchronized spikes in different neurons. The manner in which correlated spike timing affects neural codes depends on the statistics of correlations, which in turn reflects the connectivity that gives rise to correlations. However, determining the connectivity of neurons recorded in vivo can be difficult. We investigated the origins of correlated activity in genetically labeled neurons of the Drosophila antennal lobe. Dual recordings showed synchronized spontaneous spikes in projection neurons (PNs) postsynaptic to the same type of olfactory receptor neuron (ORN). Odors increased these correlations. The primary origin of correlations lies in the divergence of each ORN onto every PN in its glomerulus. Reciprocal PN-PN connections make a smaller contribution to correlations and PN spike trains in different glomeruli were only weakly correlated. PN axons from the same glomerulus reconverge in the lateral horn, where pooling redundant signals may allow lateral horn neurons to average out noise that arises independently in these PNs.


Figures

Figure 1
Figure 1. Homotypic PNs produce correlated spikes
a. Schematic of the Drosophila antennal lobe circuit. b. Results of simultaneous cell-attached recordings from homotypic ipsilateral PNs in glomerulus DM6. Average response of each PN to the odor 1-butanol is shown in black and blue (average of 13 trials). Bar indicates the 500-ms period of odor stimulation. Pearson’s r = 0.96 ± 0.02 for ipsilateral pairs (n = 15) and 0.96 ± 0.01 for contralateral pairs (n = 7) (p < 10−7 for all pairs). c. Average 1-butanol responses of DM6 PNs in four different brains. Variability between trial-averaged responses is significantly larger between brains than within a brain (Pearson’s r = 0.49 ± 0.06, n = 52; p < 10−8 compared to both ipsi- and contralateral within-brain pairs, t-test). d. Raster plots showing highly correlated responses of a DM6 PN pair to 1-butanol (same cells as in b). e. Simultaneous cell-attached recordings of spontaneous spikes from the same cells as in b and d.
Figure 2
Figure 2. Correlations in spontaneous activity
a. Simultaneous cell-attached recordings of spontaneous spikes from homotypic ipsilateral PNs (DM6), homotypic contralateral PNs (DM6), and heterotypic ipsilateral PNs (DM4 and DL5). Black and blue are cell 1 and 2, respectively. b. Average cross-correlation functions for each type of pair (n = 15, 7, and 8 pairs for homotypic-ipsi, homotypic-contra, and heterotypic-ipsi, respectively). Gray band is ± s.e.m. across pairs.
Figure 3
Figure 3. Correlations in odor-evoked activity
a. Simultaneous cell-attached recordings of odor-evoked spikes from three different PN pairs. Cells are the same as in Fig. 2. Rasters show responses to methyl salicylate, which is a relatively weak stimulus for DM6 PNs. Note the expanded time scale compared to rasters in Fig. 2a. b. Average cross-correlation functions for each type of pair (n = 15, 7, and 8 pairs for homotypic-ipsi, homotypic-contra, and heterotypic-ipsi, respectively). See Methods for olfactory stimuli. Gray band is ± s.e.m. across pairs. c. Average correlation coefficient for four different types of PN pairs (n = 15, 7, 8, and 5 pairs for homotypic-ipsi, homotypic-contra, heterotypic-ipsi, and heterotypic-contra, respectively). Correlation differs among pairs (p < 10−4, two-way ANOVA) and becomes higher during olfactory stimulation (p < 10−4, two-way ANOVA). Bars are s.e.m. d. Correlation coefficient increases near the transition between spontaneous firing rates and odor-evoked firing rates (homotypic ipsilateral pairs, n = 15).
Figure 4
Figure 4. Each PN receives input from all the ORNs in its glomerulus
a. Simultaneous whole-cell recordings from homotypic ipsilateral PNs (DM6). Spontaneous EPSCs are synchronous and correlated in amplitude. A pair with a relatively low rate of EPSCs is displayed so that individual EPSCs can be distinguished clearly. b. Homotypic contralateral PNs (DM6, same brain as in a). c. Homotypic contralateral PNs in a different glomerulus (DM4). One antenna was removed to decrease the rate of spontaneous EPSCs. d. EPSCs are asynchronous in heterotypic ipsilateral PNs (DM4 and DL5). One antenna was removed to decrease the rate of spontaneous EPSCs. e. Cross-correlation is higher in homotypic pairs compared to heterotypic pairs, and even higher in ipsi- compared to contralateral pairs (n = 5, 4, and 4 for homotypic-ipsi, homotypic-contra, and heterotypic-ipsi, respectively; p = 10−10, ANOVA; p < 0.01 in post hoc Tukey HSD for all combinations). Note that the absolute value of the cross-correlation calculated from continuous current traces (Figs. 5 and 7) cannot be directly compared with that calculated from spike trains (Figs. 2–4). f. A projection of a confocal stack through an antenna. Each GFP-positive ORN soma (arrowhead) expresses the odorant receptor Or59b (Or59b-Gal4/+;UAS-nls:GFP/+). The number of these ORNs multiplied by their mean firing rate predicts the mean spontaneous EPSC rate in DM4 PNs. g. A simultaneous recording from ORN pairs shows that spikes are independent in homotypic ORNs. Large spikes in this sensillum arise from DM4 ORNs (cell A) and small spikes arise from a different ORN type (cell B). h. No correlation between DM4 ORN spike trains (computed over a 500-ms period beginning 100 ms after nominal stimulus onset, averaged across 6 pairs of DM4 ORNs, ± s.e.m. in gray, odor is 1-butanol or ethyl acetate).
Figure 5
Figure 5. Short-term depression correlates the amplitudes of synchronous EPSCs
a. Amplitude of synchronous EPSCs is correlated in a typical homotypic PN pair (DM4, contralateral, one antenna removed, Pearson’s r = 0.64, p < 10−10). b. EPSCs recorded in response to electrical stimulation of the antennal nerve. When ORNs are stimulated with a long inter-pulse interval (30 s), EPSCs are consistently large (top). A short inter-pulse interval (0.25 s) produces short-term depression (bottom). See also Supplementary Fig. 2. c. Inter-spike intervals are irregular in DM4 ORNs. Histogram shows the distribution of inter-spike intervals averaged across ORNs (n = 11 ORNs). Gray band is ± s.e.m. d. Simulated synaptic currents in two PNs. e. Simulation recapitulates the correlation between the amplitudes of synchronous EPSCs. f. Correlation between EPSC amplitudes is absent in a model without short-term synaptic depression. g. Correlation is also absent when presynaptic spikes occur with a constant inter-spike interval.
Figure 6
Figure 6. Central circuits contribute to correlated noise
a. In order to isolate central input to a glomerulus, direct ORN input to that glomerulus was acutely removed while preserving ORN input to most other glomeruli. This was achieved by removing the maxillary palps and recording from a pair of palp PNs (glomerulus VM7). The antennae (which provide input to most glomeruli) are intact. b. Simultaneous whole-cell recordings from ipsi- and contralateral homotypic PN pairs (VM7). c. Correlation is higher in ipsilateral pairs than in contralateral pairs (computed in a 500-ms window beginning 100 ms after nominal stimulus onset, n = 5 for each; p < 10−4, two-way ANOVA). Olfactory stimulation of the antennae did not affect correlation (p = 0.57, two-way ANOVA).
Figure 7
Figure 7. PNs in the same glomerulus are reciprocally connected
a. Simultaneous whole-cell recordings from two PNs in the same glomerulus (DM6). Current injection into cell 1 produces voltage changes which are transmitted to cell 2 (left) and vice versa (right). Antennae are removed to reduce spontaneous fluctuations. Note small action potentials when the Command neuron is depolarized above its threshold. Response traces are averages of 50 trials. b. Membrane potential change in Response cell plotted as a function of membrane potential change in Command cell. Solid lines are linear fits to data from homotypic pairs in that quadrant. Note that the strength of coupling is stronger during depolarization as compared to hyperpolarization. Coupling is negligible between heterotypic PN pairs. c. Blocking chemical transmission (100 μM Cd2+) selectively reduces but does not abolish the transmission of depolarizing steps to the responding cell. d. Coupling coefficient (Response/Command) with and without chemical neurotransmission. Coupling coefficient is larger for depolarizing steps (p = 0.007, two-way ANOVA, p < 0.01 post hoc Tukey HSD), but this effect is blocked by Cd2+ (p > 0.05, post hoc Tukey HSD). Coupling coefficient for hyperpolarizing steps is not affected by Cd2+ (p > 0.05, post hoc Tukey HSD).
Figure 8
Figure 8. Axonal projections of homotypic PNs
a. A pair of ipsilateral DM6 PNs in the same brain filled with different fluorescent dyes. The image is a z-projection of a confocal stack. In the mushroom body, homotypic PN axons target different microdomains, but they are highly congruent in the lateral horn. Scale bar = 20 μm. The apparently overlapping boutons in the mushroom body are actually in different z-planes. b,c. Pairs of DM6 PNs from two other brains. In the lateral horn, note that PN axons are especially congruent in the dorsal branch, with less congruence in the ventral branch. Scale bar = 15 μm. d. Histograms of distances between the nearest axonal processes belonging to different homotypic ipsilateral PNs. The average distance is significantly shorter in the lateral horn than in the mushroom body (1.2 ± 0.0 vs 6.1 ± 0.1μm, p < 10−10, Mann-Whitney U-test).

References

    1. Usrey WM, Reid RC. Synchronous activity in the visual system. Annu Rev Physiol. 1999;61:435–56. - PubMed
    1. Salinas E, Sejnowski TJ. Correlated neuronal activity and the flow of neural information. Nat Rev Neurosci. 2001;2:539–50. - PMC - PubMed
    1. Averbeck BB, Latham PE, Pouget A. Neural correlations, population coding and computation. Nat Rev Neurosci. 2006;7:358–66. - PubMed
    1. Meister M, Lagnado L, Baylor DA. Concerted signaling by retinal ganglion cells. Science. 1995;270:1207–10. - PubMed
    1. Dan Y, Alonso JM, Usrey WM, Reid RC. Coding of visual information by precisely correlated spikes in the lateral geniculate nucleus. Nat Neurosci. 1998;1:501–7. - PubMed

Publication types

MeSH terms

LinkOut - more resources