. 2009 Sep;6(9):667-72.
doi: 10.1038/nmeth.1366. Epub 2009 Aug 16.

A 3D digital atlas of C. elegans and its application to single-cell analyses

Affiliations

A 3D digital atlas of C. elegans and its application to single-cell analyses

Fuhui Long et al. Nat Methods. 2009 Sep.

Abstract

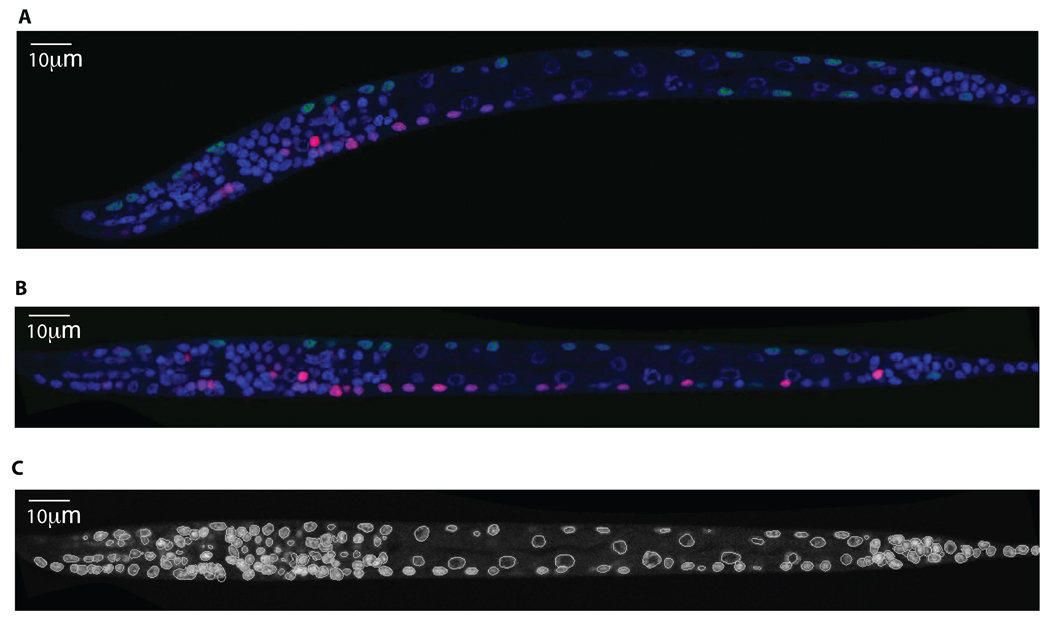
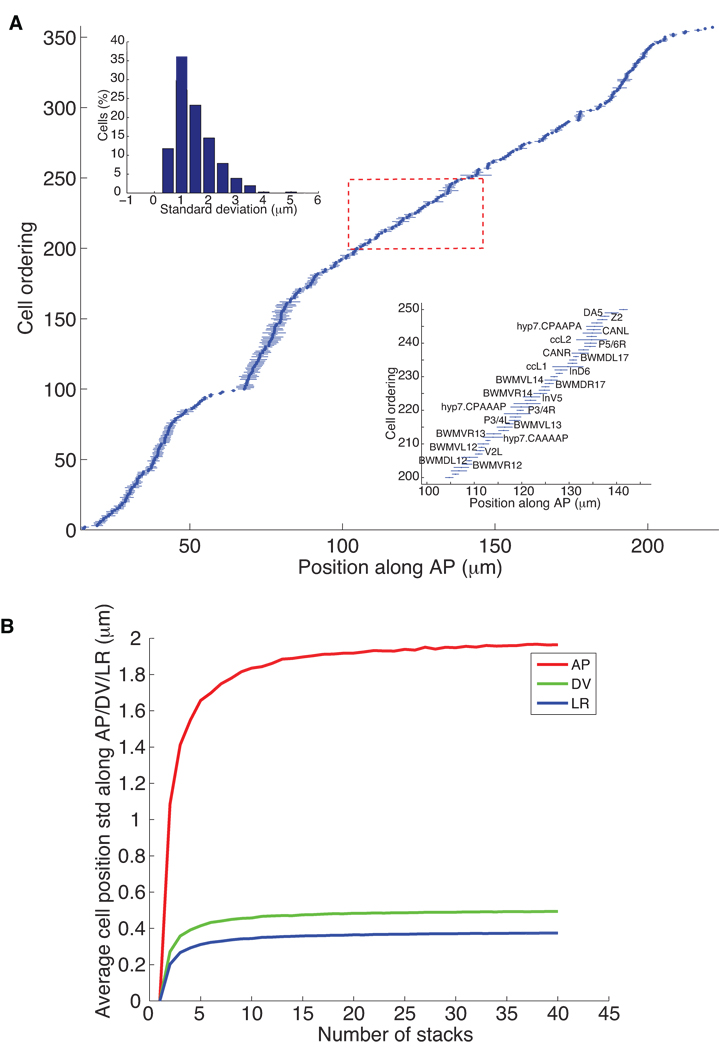
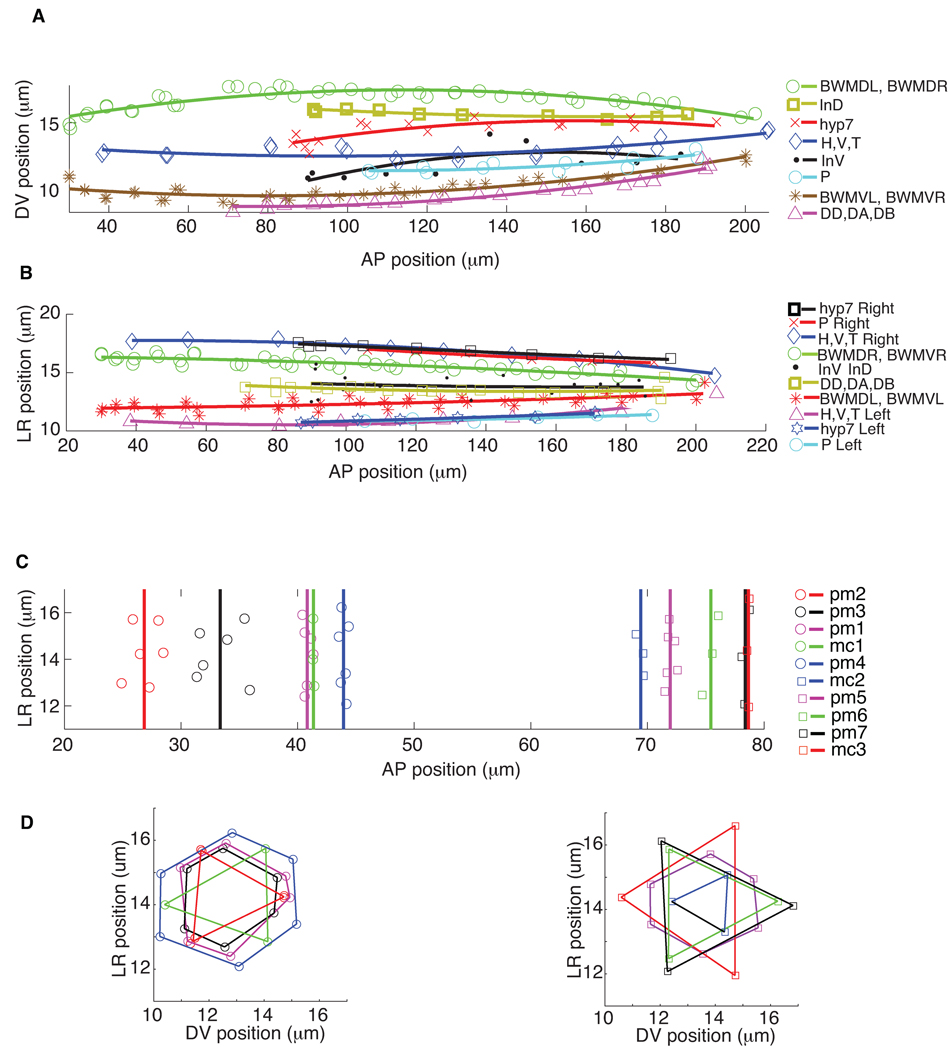
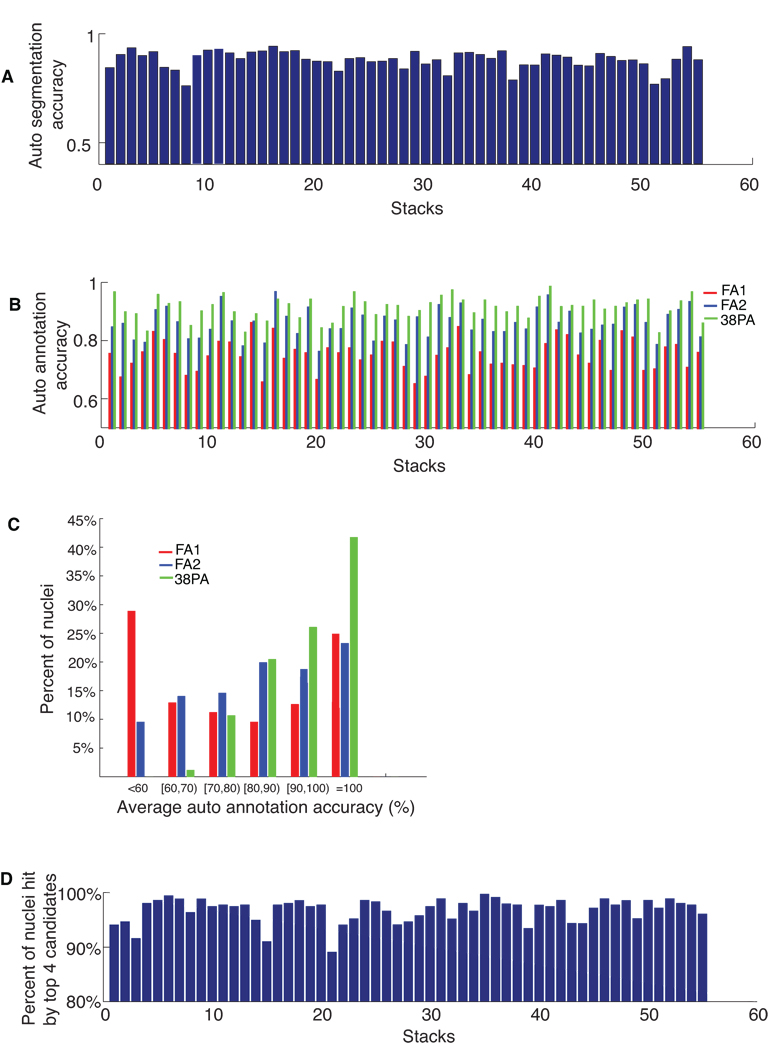
We built a digital nuclear atlas of the newly hatched, first larval stage (L1) of the wild-type hermaphrodite of Caenorhabditis elegans at single-cell resolution from confocal image stacks of 15 individual worms. The atlas quantifies the stereotypy of nuclear locations and provides other statistics on the spatial patterns of the 357 nuclei that could be faithfully segmented and annotated out of the 558 present at this developmental stage. We then developed an automated approach to assign cell names to each nucleus in a three-dimensional image of an L1 worm. We achieved 86% accuracy in identifying the 357 nuclei automatically. This computational method will allow high-throughput single-cell analyses of the post-embryonic worm, such as gene expression analysis, or ablation or stimulation of cells under computer control in a high-throughput functional screen.


Figures

Figure 1
Figure 1
Automatic processing of a 3D image of C.elegans. (a) A 2D slice of a 3D image. DAPI (blue) is used to stain nuclei of all the 558 cells; Pmyo-3::NLS::GFP (green) is used to stain nuclei of the 81 body wall muscle cells and 1 depressor cell; mCherry (red) is used to stain nuclei of the cells that express gene of interest, in this example, some ventral motor neurons and neurons in the nerve ring. (b) The same 2D slice after worm body straightening. (c) The segmentation result of the DAPI channel of same 3D image, with the same 2D slice shown in A.
Figure 2
Figure 2
Statistics of nuclei positions. (a) The mean and standard deviations of the locations of 357 nuclei along the AP axis computed from 15 randomly selected images of hermaphrodites at the first larval stage. The horizontal axis is the position of nuclei along the AP axis (in µm), the posterior direction being positive. The vertical axis is the ordering of the nuclei sorted according to their mean locations along AP. The dots are the mean locations of the corresponding nuclei and the lines are their standard deviations. The bottom-right inset shows the names of a subset of the 357 nuclei. The up-left inset shows the distribution of the standard deviation of nuclear locations of all the 357 nuclei. (b) The average standard deviation of nuclei positions along AP, DV, and LR dimensions as functions of the number of stacks used to build the atlas.
Figure 3
Figure 3
The nuclei spatial location patterns of different types of cells. (a) and (b) are the nuclei locations of the four bundles of body wall muscle cells (BWMDL, BWMDR, BWMVL, and BWMVR) and most of the trunk cells including dorsal and ventral intestinal cells (InD and InV), trunk hypodermal cells (hyp7), H, V, T, and P cells, as well as ventral motor neurons (DD, DA, DB), projected onto the AP-DV plane and AP-LR plane respectively. For better visualization, we did quadratic polynomial fitting for each type of cells. (c) and (d) are the nuclei locations of the 7 rings of pharyngeal muscle cell nuclei (pm) and the 3 rings of marginal cell nuclei (mc) in the head projected onto AP-DV and AP-LR plane. Vertical lines show the mean locations of each ring along AP dimension. On the AP-LR plane, nuclei of the same ring are connected in lines.
Figure 4
Figure 4
AP graph of (a) the H,V,T,P, and In (intestinal cells) and (b) the pm (pharyngeal muscle) and mc (marginal cells) nuclei derived from the atlas. The graph is displayed after transitive reduction. Thus if there is a directed path from node a to node b, and from node b to node c, then the transitively inferable edge from a to c is removed.
Figure 4
Figure 4
AP graph of (a) the H,V,T,P, and In (intestinal cells) and (b) the pm (pharyngeal muscle) and mc (marginal cells) nuclei derived from the atlas. The graph is displayed after transitive reduction. Thus if there is a directed path from node a to node b, and from node b to node c, then the transitively inferable edge from a to c is removed.
Figure 5
Figure 5
Mean and standard deviations of nuclei sizes for different types of cells. BWMVL: body wall muscle ventral left bundle; BWMVR: body wall muscle ventral right bundle; BWMDL: body wall muscle dorsal left bundle; BWMDR: body wall muscle dorsal right bundle; InV and InD: intestine ventral and dorsal cells; hyp: hypodermal cells; DD, DA and DB: ventral motor neurons; HL and HR: H cell left and right bundles; VL and VR: V cell left and right bundle; TL and TR: T cell left and right; pm: pharyngeal muscle; mc: marginal cells in pharynx; vpi: pharyngeal intestinal valve cells; e: pharyngeal epithelial cells; g: pharyngeal gland cells; M: pharyngeal motor neuron; I: pharyngeal motor neurons; cc: coelomocyte; MI, NSM(L,R): pharyngeal motor interneuron, and secretory motor neuron; other neurons include BDU(L,R), ALM(L,R), CAN(L,R), Q(L,R),AVG, SABD, SABV(L,R), RIG(L,R), RIF(L,R), PVT, PVP(L,R), PVQ(L,R), PHA(L,R), PHB(L,R), LUA(L,R), PVC(L,R), ALN(L,R), PHsh(L,R), PLM(L,R), PVR, DVA, and DVC.
Figure 6
Figure 6
Accuracies of automated segmentation and annotation of 55 image stacks. (a) The accuracies of automatic segmentation for each stack. (b) The accuracies of automated annotation of the 357 nuclei. Red bars: fully automated segmentation followed by fully automated annotation (FA1). Blue bars: manually curated segmentation followed by fully automated annotation (FA2). Green bars: manually curated segmentation followed by automated annotation of 319 nuclei in each stack. The remaining 38 nuclei with big spatial variations across individuals were pre-annotated (PA) manually. (c) Percentages of nuclei falling into different annotation accuracy ranges for fully automatic annotation of 357 nuclei (FA1; red bars and FA2; blue bars) and for automatic annotation of 319 nuclei (PA; green bars). (d) Percentages of nuclei among 357 whose identities can be hit by the top 4 candidates for each stack.

Comment in

  • Google 'EarthWorm'.
    Mohler WA. Mohler WA. Nat Methods. 2009 Sep;6(9):635-6. doi: 10.1038/nmeth0909-635. Nat Methods. 2009. PMID: 19718015 No abstract available.

References

    1. Riddle DL, Blumenthal T, Meyer BJ, Priess JR. C. elegans II. Cold Sprint Harbor Laboratory Press; 1997. - PubMed
    1. Sulston JE, Schierenberg E, White JG, Thomson JN. The embryonic cell lineage of the nematode Caenorhabditis elegans. Dev Biol. 1983;100:64–119. - PubMed
    1. Sulston JE, Horvitz HR. Post-embryonic cell lineages of he nematode, Caenorhabditis elegmans. Dev. Biol. 1977;56:110–156. - PubMed
    1. White JG, Southgate E, Thomson JN, Brenner S. The structure of the nervous system of the nematode C. elegans. Phil. Trans. Royal Soc. London. Series B, Biol Scien. 1986;314:1. - PubMed
    1. Chen BL, Hall DH, Chklovskii DB. Wiring optimization can relate neuronal structure and function. Proc. Natl. Acad. Sci. USA. 2006;103:4723–4728. - PMC - PubMed

Publication types