. 2009 Oct 29;28(43):3801-13.
doi: 10.1038/onc.2009.234. Epub 2009 Aug 17.

Nuclear EGFR contributes to acquired resistance to cetuximab

Affiliations

Nuclear EGFR contributes to acquired resistance to cetuximab

C Li et al. Oncogene. .

Abstract

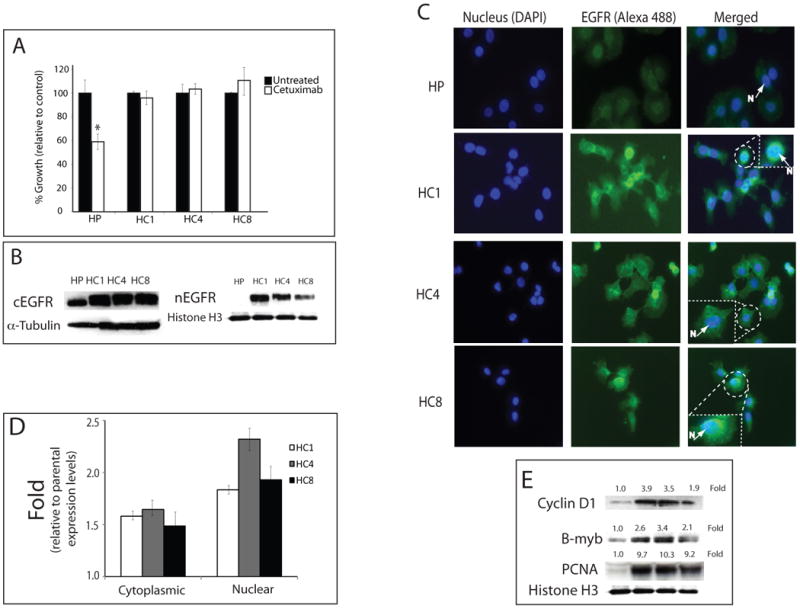
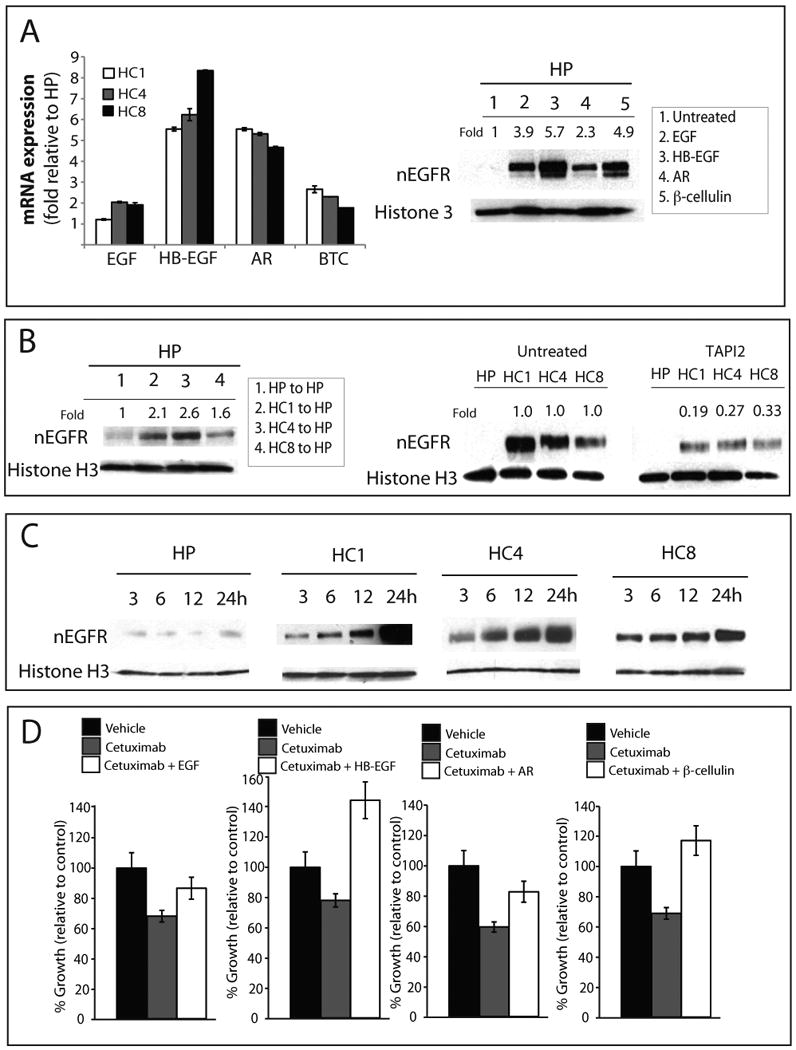
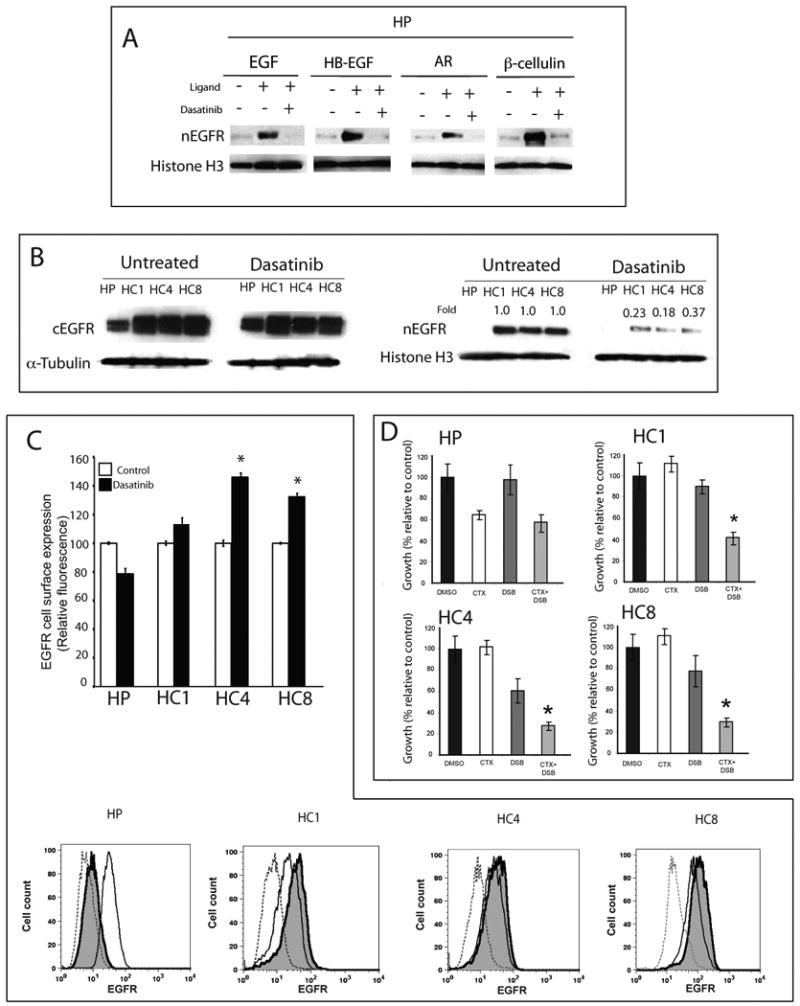
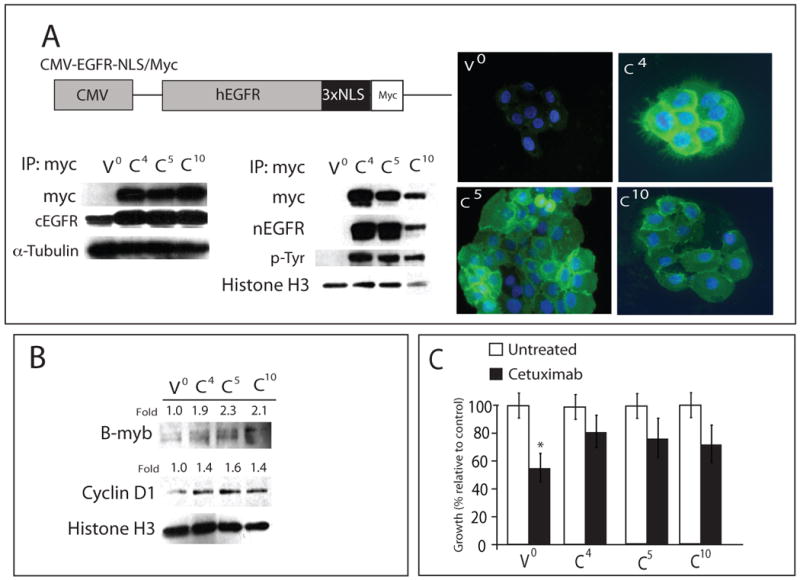
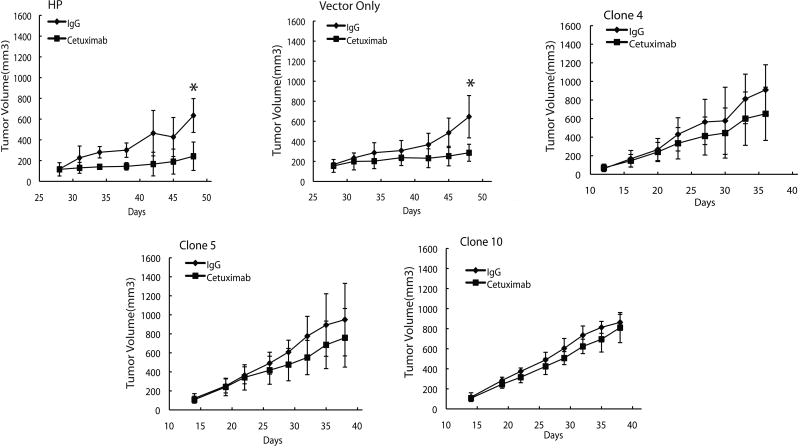
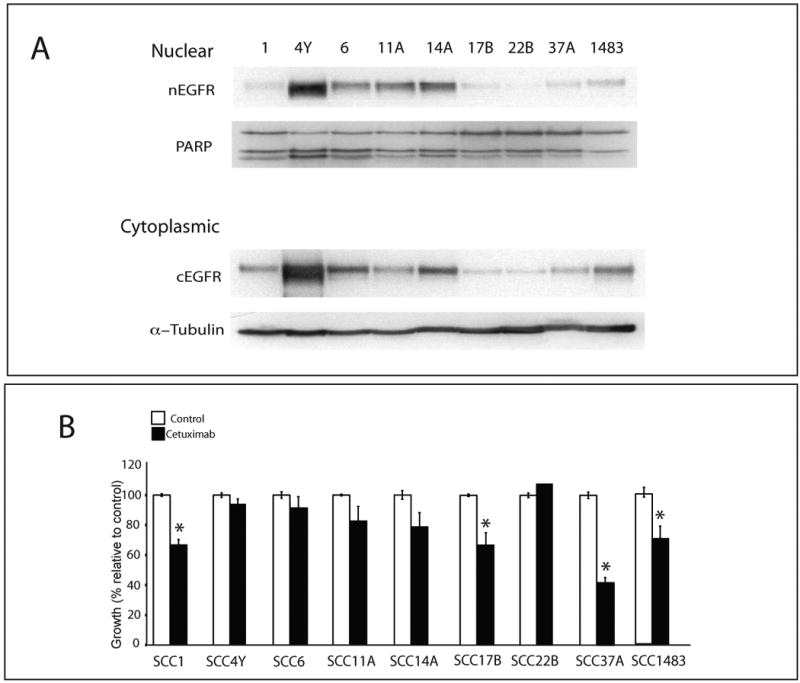
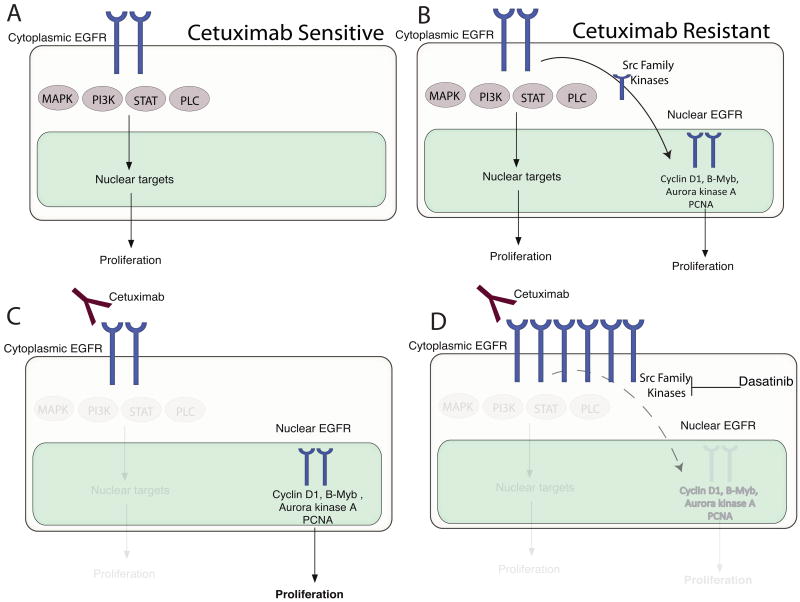
Epidermal growth factor receptor (EGFR) is a ubiquitously expressed receptor tyrosine kinase involved in the etiology of several human cancers. Cetuximab is an EGFR-blocking antibody that has been approved for the treatment of patients with head and neck squamous cell carcinoma and metastatic colorectal cancer. Previous reports have shown that EGFR translocation to the nucleus is associated with cell proliferation. Here we investigated mechanisms of acquired resistance to cetuximab using a model derived from the non-small cell lung cancer line H226. We demonstrated that cetuximab-resistant cells overexpress HER family ligands including epidermal growth factor (EGF), amphiregulin, heparin-binding EGF and beta-cellulin. Overexpression of these ligands is associated with the nuclear translocation of the EGFR and this process was mediated by the Src family kinases (SFK). Treatment of cetuximab-resistant cells with the SFK inhibitor, dasatinib, resulted in loss of nuclear EGFR, increased membrane expression of the EGFR and resensitization to cetuximab. In addition, expression of a nuclear localization sequence-tagged EGFR in cetuximab-sensitive cells increased resistance to cetuximab both in vitro and in mouse xenografts. Collectively, these data suggest that nuclear expression of EGFR may be an important molecular determinant of resistance to cetuximab therapy and provides a rationale for investigating nuclear EGFR as a biomarker for cetuximab response. Further, these data suggest a rationale for the design of clinical trials that examine the value of treating patients with cetuximab-resistant tumors with inhibitors of SFKs in combination with cetuximab.


Conflict of interest statement

Conflict of interest: The authors declare no conflict of interest.

Figures

Figure 1
Figure 1. Cetuximab-resistant cells have increased nuclear EGFR expression
A) Cetuximab growth response using the NSCLC line NCI-H226 cetuximab-resistant clones. Cells were treated with 100 nM of cetuximab and growth was measured using the growth proliferation assay as described in materials and methods. Results are graphed as a percentage of growth relative to the untreated control cells. HP; cetuximab-sensitive parental line, HC1, HC4, HC8; cetuximab-resistant clones. Data points are represented as mean +/- SEM. (n=3). *, P<0.05 B) Nuclear EGFR is increased in cetuximab-resistant cells. After harvesting cetuximab-resistant cells (HC1, HC4 and HC8) and parental control (HP), cytoplasmic and nuclear protein was collected and fractionated by SDS-PAGE followed by immunoblotting for the indicated proteins. α-tubulin and histone H3 were used as loading and purity controls of each cellular fraction. C) Expression of nEGFR in cetuximab-resistant cells by immunofluorescence microscopy. EGFR is shown in the middle column (green), the left column shows DNA (blue) and the right column is a merged image of EGFR and DNA. Box represents enlarged area of insert. N; Nucleus, HP; cetuximab-sensitive parental line, HC1, HC4, HC8; cetuximab-resistant clones. 200× magnification. D) Fold change of EGFR intensity levels in cetuximab-resistant clones relative to parental controls. Intensity of EGFR in each cetuximab-resistant clones (HC1, HC4, HC8) were measured by BD Pathway 855 (BD sciences, San Jose, CA) and graphed as fold change relative to the parental cell lines (HP). Data points are presented as mean +/- SEM. (n=10). E) Relative amounts of cyclin D1, B-myb and PCNA in cetuximab-resistant clones. (HC1, HC4, HC8) were quantified by ImageJ software and normalized against the parental, cetuximab-sensitive line (HP). histone H3 was used as a loading and nuclear fraction purity control.
Figure 2
Figure 2. Nuclear EGFR in cetuximab-resistant cells is driven by EGFR ligands
A) Real-time quantitative PCR analysis of HER family ligands in cetuximab-resistant clones HC1, HC4 and HC8. Data is represented as fold increase relative to the HP parental control. Data points are represented as mean +/- SEM. (n=3). Parental cells (HP) were treated with 200 ng/mL of each HER family ligand for 1 hour after 24 hours of serum starvation. Cells were harvested and nuclear protein was fractionated by SDS-PAGE followed by immunoblotting for indicated proteins. histone H3 was used as a loading control. Expression of nuclear EGFR (nEGFR) after treatment with each ligand was quantitated using ImageJ software and normalized against untreated cells. B) Conditioned media from cetuximab-resistant cells can lead to increased nuclear translocation of the EGFR. Conditioned media from cetuximab-resistant clones (HC1, HC4, HC8) or parental cells (HP) was placed on HP cells and incubated for 1 hours; cetuximab-resistant cells and parental control were treated with 100 μM TAPI2 for 24 hours. Cells were harvested and nuclear protein fractionated on SDS-PAGE followed by immunoblotting for EGFR. histone H3 was used as a loading control. Expression of nEGFR was quantitated using ImageJ software; the untreated cells were compared to TAPI2 treated cells. C) Serum starvation leads to increased nEGFR in cetuximab-resistant clones, but not parental cell lines. Cetuximab-resistant cells and parental control were placed in serum-free medium and cells were harvested at 3, 6, 12 and 24 hours. Nuclear protein was fractionated by SDS-PAGE followed by immunoblotting for anti-EGFR antibody. histone H3 was used as loading control. D) HER family ligands can enhance cetuximab resistance in cetuximab-sensitive cells. HP cells were treated with cetuximab or the combination of cetuximab and 200 ng/ml of ligand (EGF, HB-EGF, AR or β-cellulin) for 72 hours. Growth was measured at 72 hours after treatment using proliferation assays and plotted as a percentage of growth relative to the untreated control cells. Data points are represented as mean +/- SEM. (n=3).
Figure 3
Figure 3. Src family kinases mediate ligand-induced EGFR translocation to the nucleus
A) Dasatinib inhibits HER family ligands signaling in parental cells (HP). HP cells were untreated, treated for 24 hours with 50 nM of dasatinib alone, or followed by 200 ng/ml of indicated ligand for 1 hour prior to harvesting. Nuclear protein was collected and fractionated by SDS-PAGE followed by immunoblotting for EGFR. histone H3 was used as loading control. B) Dasatinib inhibits nuclear expression of EGFR in cetuximab-resistant cell lines. Parental cells (HP) and cetuximab-resistant cell lines (HC1, HC4, HC8) were treated with 50 nM of dasatinib for 24 hours. After cells were harvested, cytoplasmic and nuclear protein was fractionated by SDS-PAGE followed by immunoblotting for EGFR. α-tubulin and histone H3 were used as loading controls and purity controls of each cellular fraction. Expression of nEGFR after dasatinib treatment in cetuximab-resistant clones was quantitated using ImageJ software and normalized against the amounts of untreated cells. C) Dasatinib treatment lead to increased membrane-bound EGFR in cetuximab-resistant cells by flow cytometry analysis. Parental cells (HP) and cetuximab-resistant cells (HC1, HC4 and HC8) were treated with DMSO or 50 nM of dasatinib for 24 hours and membrane expression is represented relative to untreated controls. Mean surface expression of EGFR is represented +/- SEM (n=3). Flow cytometric plots of representative experiments are presented. Shaded histograms represent dasatinib treatment. Controls (dotted line) represent cells labeled with FITC-conjugated normal mouse IgG *, P<0.05 D) Dasatinib re-sensitizes cetuximab-resistant cells to cetuximab growth inhibition. Cetuximab-resistant cells (HC1, HC4 and HC8) and parental controls (HP) were treated with DMSO, 100 nM cetuximab (CTX), 25 nM dasatinib (DSB) or the combination for 72 hours. Growth was measured using the proliferation assay and plotted as a percentage of growth relative to the untreated control cells. Data points are represented as mean +/- SEM. (n=6). *, P<0.05
Figure 4
Figure 4. EGFR tagged with nuclear localization sequence confers resistance to cetuximab in vitro
A) A schematic representation of the CMV-EGFR-NLS/Myc construct is shown. EGFR-NLS/Myc was driven by the CMV promoter. The cetuximab-sensitive NSCLC line NCI-H226 was infected with indicated constructs. Represented is three individual clones and vector control (V0; vector only, C4, C5 and C10). Cytoplasmic and nuclear protein from each clone was collected and immunoprecipitated with an anti-myc antibody, fractionated on SDS-PAGE and immunoblotted with the indicated antibodies. α-tubulin and histone H3 were used as loading and purity control for cytosolic and nuclear fractions, respectively. Immunofluorescence of nEGFR staining in CMV-EGFR-NLS/Myc clones. EGFR (green), DNA (blue), stained by PI. V0; vector clone, C4, C5 and C10; CMV-EGFR-NLS/Myc clones. 400× magnification. cEGFR; cytoplasmic EGFR, nEGFR; nuclear EGFR. B) CMV-EGFR-NLS/Myc expressed in NCI-H226 leads to increased cyclin D1 and B-myb expression. Nuclear protein from EGFR-NLS/myc clones was collected and fractionated by SDS-PAGE followed by immunoblotting for the indicated proteins. histone H3 was used as a loading control. Expression of cyclin D1 and B-myb in CMV-EGFR-NLS/Myc clones (C4, C5 and C10) were quantitated using ImageJ software and normalized against the amounts of those proteins in vector control (V0). V0; vector clone, C4, C5 and C10; CMV-EGFR-NLS/Myc clones. C) Growth response to cetuximab of three individual clones and vector control (V0; vector only, C4, C5 and C10). CMV-EGFR-NLS/Myc-tag clones (C4, C5 and C10) were treated with 100 nM of cetuximab and growth was measured using the growth proliferation assay and plotted as growth relative to untreated control. Data points are represented as mean +/- SEM. (n=3). *, P<0.05
Figure 5
Figure 5. Overexpression of a NLS tagged EGFR in cetuximab-resistant cells confers resistance to cetuximab in vivo
Male athymic nude mice were injected subcutaneously with 1×10⁶ cetuximab-sensitive parental cells (HP) or CMV-EGFR-NLS/Myc clone cells (Vector only, Clone 4, Clone 5 and Clone 10) into the dorsal flank. Once tumors reached a volume 120-180mm3 mice were treated with 0.1 mg IgG or cetuximab twice weekly. Tumor diameters were measured serially with calipers and tumor volumes were calculated. Points, mean tumor volume of eight mice per group; bars, SD. T-test was used to compare tumor volumes between cetuximab treated and control IgG mice. *, P<0.05
Figure 6
Figure 6. Nuclear EGFR expression in head and neck squamous cell carcinoma lines with intrinsic resistance to cetuximab
A) Immunoblot analysis of cytoplasmic (cEGFR) and nuclear (nEGFR) expression in head and neck squamous cancer cell (HNSCC) lines. Cells were harvested and cytoplasmic and nuclear protein collected and fractionated by SDS-PAGE followed by immunoblotting for EGFR. α-tubulin and PARP were used as loading and purity control for cytosolic and nuclear fractions, respectively. B) Cetuximab growth response using HNSCC lines. HNSCC lines were treated with 5 nM cetuximab for 72 hours. Growth was measured using the MTT assays and plotted as a percentage of growth relative to the untreated control cells. Data points are represented as mean +/- SEM. (n=3).
Figure 7
Figure 7. Potential mechanism for resistance to cetuximab
A) Cetuximab-sensitive cells depend on classical EGFR membrane signaling. B) Tumor cells that acquire resistance to cetuximab gain nEGFR as a second compartment of proliferation. C) Cetuximab can abrogate signals from plasma membrane EGFR but not nEGFR; nEGFR continues to send proliferative signals by modulation of Cyclin D1, B-myb, Aurora kinase K and regulation of PCNA. D) The SFK inhibitor dasatinib inhibits nuclear translocation of the EGFR from the plasma membrane leading to increased EGFR on the plasma membrane and restoring sensitivity to cetuximab.

References

    1. Arteaga CL. EGF receptor as a therapeutic target: patient selection and mechanisms of resistance to receptor-targeted drugs. J Clin Oncol. 2003;21:289s–291s. - PubMed
    1. Bandyopadhyay D, Mandal M, Adam L, Mendelsohn J, Kumar R. Physical interaction between epidermal growth factor receptor and DNA-dependent protein kinase in mammalian cells. J Biol Chem. 1998;273:1568–73. - PubMed
    1. Bianco R, Troiani T, Tortora G, Ciardiello F. Intrinsic and acquired resistance to EGFR inhibitors in human cancer therapy. Endocr Relat Cancer. 2005;12:S159–171. - PubMed
    1. Borrell-Pagès M, Rojo F, Albanell J, Baselga J, Arribas J. TACE is required for the activation of the EGFR by TGF-alpha in tumors. EMBO J. 2003;22:1114–24. - PMC - PubMed
    1. Camp ER, Summy J, Bauer TW, Liu W, Gallick GE, Ellis LM. Molecular Mechanisms of Resistance to Therapies Targeting the Epidermal Growth Factor Receptor. Clin Cancer Res. 2005;11:397–405. - PubMed