. 2009 Oct 29;28(43):3765-74.
doi: 10.1038/onc.2009.238. Epub 2009 Aug 17.

A gene expression signature classifying telomerase and ALT immortalization reveals an hTERT regulatory network and suggests a mesenchymal stem cell origin for ALT

Affiliations

A gene expression signature classifying telomerase and ALT immortalization reveals an hTERT regulatory network and suggests a mesenchymal stem cell origin for ALT

K Lafferty-Whyte et al. Oncogene. .

Abstract

Telomere length is maintained by two known mechanisms, the activation of telomerase or alternative lengthening of telomeres (ALT). The molecular mechanisms regulating the ALT phenotype are poorly understood and it is unknown how the decision of which pathway to activate is made at the cellular level. We have shown earlier that active repression of telomerase gene expression by chromatin remodelling of the promoters is one mechanism of regulation; however, other genes and signalling networks are likely to be required to regulate telomerase and maintain the ALT phenotype. Using gene expression profiling, we have uncovered a signature of 1305 genes to distinguish telomerase-positive and ALT cell lines. By combining this with the gene expression profiles of liposarcoma tissue samples, we refined this signature to 297 genes. A network analysis of known interactions between genes within this signature revealed a regulatory signalling network consistent with a model of human telomerase reverse transcriptase (hTERT) repression in ALT cell lines and liposarcomas. This network expands on our existing knowledge of hTERT regulation and provides a platform to understand differential regulation of hTERT in different tumour types and normal tissues. We also show evidence to suggest a novel mesenchymal stem cell origin for ALT immortalization in cell lines and mesenchymal tissues.


Figures

Figure 1
Figure 1
Gene expression analysis of ALT and telomerase positive cell lines. (a) Boxplots show distribution of normalised data in ALT and telomerase positive cell line groups. Grey boxes define 25 and 75% quartiles, while error bars represent the 1st and 99th percentiles of the distribution. Dots represent outliers, black line represents the median, while the cross represents the mean of the distribution. (b) Overview of signature generation from cell line and liposarcoma tissue samples. A refined 297 gene signature was generated from a combination of the 1305 gene cell line signature and the 6719 gene liposarcoma signature. This signature shows a potential mesenchymal stem cell origin for ALT and is involved in telomerase gene regulation. Gene Expression Data submitted to NCBI GEO http://www.ncbi.nlm.nih.gov/geo/ ) under accession number GSE14533.
Figure 2
Figure 2
Gene expression profiling distinguishes telomerase positive and ALT cell lines and is suggestive of a mesenchymal stem cell origin for ALT. (a) Scatter plot representing normalised microarray expression values for the 1305 gene signature in ALT (blue) and telomerase positive (red) cell lines relative to overall median expression value. Each dot represents the mean gene expression values for a gene, while error bars represent the standard error. (b) Hierarchical clustering of the cell line data performed using the Spearman correlation, average linkage and merging branches with a similarity correlation of 0.001 or less using the 1305 signature accurately separates telomerase positive (red) from ALT (blue) cell lines. (c) Hierarchical clustering of telomerase positive (red) and ALT (blue) cell lines, normal fibroblasts (purple) and hMSC (green) performed using the Spearman correlation, average linkage and merging branches with a similarity correlation of 0.001 or less with the 1305 gene signature.
Figure 3
Figure 3
Validation of the 1305 gene expression signature highlights a stem cell link. (a) Expression levels of DSC54, WNT5B, MYEOV and NSUN5 were validated by quantitative PCR in telomerase positive cell lines 5637, A2780, C33a and HT1080 (black bars) and ALT cell lines WI38-SV40, KMST6, SKLU, SUSM1 (grey bars) cell lines. Each bar represents the mean and standard error of triplicate reactions from a representative experiment normalised to GAPDH. (b) Expression values for DSC54, WNT5B and MYEOV in various normal tissues extracted from publicly available microarray expression data, compared to those for ALT and telomerase positive cell lines and hMSC. Dots represent the median while error bars represent the maximum and minimum normalised expression values.
Figure 4
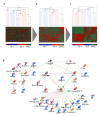
Figure 4
Hierarchical clustering of ALT and telomerase positive liposarcoma samples and hMSC distinguishes telomerase positive from ALT and highlights an hMSC origin for ALT. Liposarcoma samples were previously determined as ALT (blue) or telomerase positive (red) by classical methods. Hierarchical clustering of these samples and hMSC (green) was performed using the Spearman correlation, average linkage and merging branches with a similarity correlation of 0.001 or less using (a) all genes (b) 1305 gene signature or (c) the refined 297 gene signature. (d) Network analysis of the 297 gene signature shows hTERT regulation. Signalling network of known direct interactions between genes from the 297 gene signature drawn using the analyse network building algorithm within Metacore. Green arrows represent positive, red negative and grey unspecified interactions. Red and blue circles next to network objects represent expression data. Red: up in ALT and down in telomerase positive liposarcoma samples and cell lines; Blue: down in ALT and up in telomerase positive liposarcoma samples and cell lines. The network highlights that a number of molecules activated by c-Myc have reduced expression in ALT cells and those inhibited by c-Myc have increased expression in ALT cells. This is suggestive of lower c-Myc activity in cell using ALT.
Figure 5
Figure 5
The TERT regulatory network is shown at the protein level and predicted c-MYC activity is confirmed as significantly lower in ALT. (a) Western blotting shows protein level differences in 3 molecules of the 297 gene network. 15 μg of cell extracts were run on NuPAGE 4-12% Bis-Tris gels, transferred to Millipore nitrocellulose membrane and probed with appropriate antibodies. Blots were then stripped and reprobed with ERK1 loading control. Panels shown are representative panels of 2 separate blots. (b) c-Myc activity ELISA shows significantly lower activity in ALT cells. Interval plot shows the average of 6 ALT cell lines (WI38-SV40, KMST6, SKLU, SUSM1, SAOS and U2OS) and 4 telomerase cell lines (A2780, C33a, HT1080 and 5637) on 3 separate occasions with 4 replicates of each cell line. Crosshairs show mean expression for each group and error bars show 95% confidence intervals of the mean. T-test of the results were T-Value = −2.51 P-Value = 0.015 DF = 51.

References

    1. Atkinson SP, Hoare SF, Glasspool RM, Keith WN. Lack of telomerase gene expression in alternative lengthening of telomere cells is associated with chromatin remodeling of the hTR and hTERT gene promoters. Cancer Res. 2005;65:7585–7590. - PubMed
    1. Bernardo ME, Zaffaroni N, Novara F, Cometa AM, Avanzini MA, Moretta A, et al. Human bone marrow derived mesenchymal stem cells do not undergo transformation after long-term in vitro culture and do not exhibit telomere maintenance mechanisms. Cancer Res. 2007;67:9142–9149. - PubMed
    1. Bryan TM, Englezou A, Dalla-Pozza L, Dunham MA, Reddel RR. Evidence for an alternative mechanism for maintaining telomere length in human tumors and tumor-derived cell lines. Nat Med. 1997;3:1271–1274. - PubMed
    1. Cairney CJ, Hoare SF, Daidone MG, Zaffaroni N, Keith WN. High level of telomerase RNA gene expression is associated with chromatin modification, the ALT phenotype and poor prognosis in liposarcoma. Br J Cancer. 2008;98:1467–1474. - PMC - PubMed
    1. Cairney CJ, Keith WN. Telomerase redefined: integrated regulation of hTR and hTERT for telomere maintenance and telomerase activity. Biochimie. 2008;90:13–23. - PubMed

Publication types