. 2009 Sep;35(5):1105-22.
doi: 10.1037/a0016548.

Deficits in cross-race face learning: insights from eye movements and pupillometry

Affiliations

Deficits in cross-race face learning: insights from eye movements and pupillometry

Stephen D Goldinger et al. J Exp Psychol Learn Mem Cogn. 2009 Sep.

Abstract

The own-race bias (ORB) is a well-known finding wherein people are better able to recognize and discriminate own-race faces, relative to cross-race faces. In 2 experiments, participants viewed Asian and Caucasian faces, in preparation for recognition memory tests, while their eye movements and pupil diameters were continuously monitored. In Experiment 1 (with Caucasian participants), systematic differences emerged in both measures as a function of depicted race: While encoding cross-race faces, participants made fewer (and longer) fixations, they preferentially attended to different sets of features, and their pupils were more dilated, all relative to own-race faces. Also, in both measures, a pattern emerged wherein some participants reduced their apparent encoding effort to cross-race faces over trials. In Experiment 2 (with Asian participants), the authors observed the same patterns, although the ORB favored the opposite set of faces. Taken together, the results suggest that the ORB appears during initial perceptual encoding. Relative to own-race face encoding, cross-race encoding requires greater effort, which may reduce vigilance in some participants.


Figures

Figure 1
Figure 1
Example of areas-of-interest definitions for one stimulus photograph, with sample fixations made during 5 s of learning.
Figure 2
Figure 2
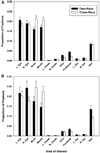
Average proportions of fixations recorded to different areas of interest (AOIs) during face encoding in Experiment 1 in (A) the 5-s encoding condition and (B) the 10-s encoding condition. In each figure, proportions of fixations are shown as a function of AOI and race. Error bars show standard errors of the means.
Figure 3
Figure 3
Average distance traveled by the eyes during face encoding, from the 10-s condition of Experiment 1. Results are shown as a function of participant group (low vs. high scoring), race of the depicted models, and trial number.
Figure 4
Figure 4
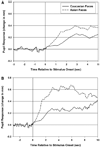
Average pupil dilation, relative to baseline, during face-encoding periods of Experiment 1. Separate functions are shown for Asian and Caucasian faces, with stimulus onsets situated at zero, in (A) the 5-s encoding condition and (B) the 10-s encoding condition.
Figure 5
Figure 5
Average pupil dilation, relative to baseline, during face-encoding periods, from the 10-s condition of Experiment 1. Results are shown as a function of participant group (low vs. high scoring) and race of the depicted models.
Figure 6
Figure 6
Average total pupil dilation, relative to baseline, in each trial of the 10-s condition of Experiment 1. Only trials with Asian faces are shown, with black and white symbols for the low- and high-scoring groups, respectively. Error bars show standard errors of the means.
Figure 7
Figure 7
Average proportions of fixations recorded to different areas of interest during face encoding in Experiment 2. Error bars show standard errors of the means.
Figure 8
Figure 8
Average distance traveled by the eyes during face encoding in Experiment 2. Results are shown as a function of participant group (low vs. high scoring), race of the depicted models, and trial number.
Figure 9
Figure 9
Average pupil dilation, relative to baseline, during face-encoding periods, from the 10-s condition of Experiment 2. Results are shown as a function of participant group (low vs. high scoring) and race of the depicted models.
Figure 10
Figure 10
Average total pupil dilation in each trial of Experiment 2. The functions with triangular symbols show trials with Caucasian faces; functions with circular symbols show trials with Asian faces. Black and white symbols represent the low- and high-scoring groups, respectively. Error bars show standard errors of the means.

References

    1. Althoff RR, Cohen NJ. Eye-movement-based memory effect: A reprocessing effect in face perception. Journal of Experimental Psychology: Learning, Memory, and Cognition. 1999;25:997–1010. - PubMed
    1. Anthony T, Copper C, Mullen B. Cross-racial facial identification: A social cognitive integration. Personality and Social Psychology Bulletin. 1992;18:296–301.
    1. Beatty J. Task-evoked pupillary responses, processing load, and the structure of processing resources. Psychological Bulletin. 1982;91:276–292. - PubMed
    1. Blais C, Jack RE, Scheepers C, Fiset D, Caldara R. Culture shapes how we look at faces. PLoS ONE. 2008;3:e3022. - PMC - PubMed
    1. Brown G, Kinderman S, Siegle G, Granholm E, Wong E, Burton R. Brain activation and pupil response during covert performance of the Stroop Colour Word task. Journal of the International Neuropsychological Society. 1999;5:308–319. - PubMed

Publication types