. 2009 Jul:1170:298-305.
doi: 10.1111/j.1749-6632.2009.04375.x.

Need for related multipronged approaches to understand olfactory bulb signal processing

Affiliations

Need for related multipronged approaches to understand olfactory bulb signal processing

Diego Restrepo et al. Ann N Y Acad Sci. 2009 Jul.

Abstract

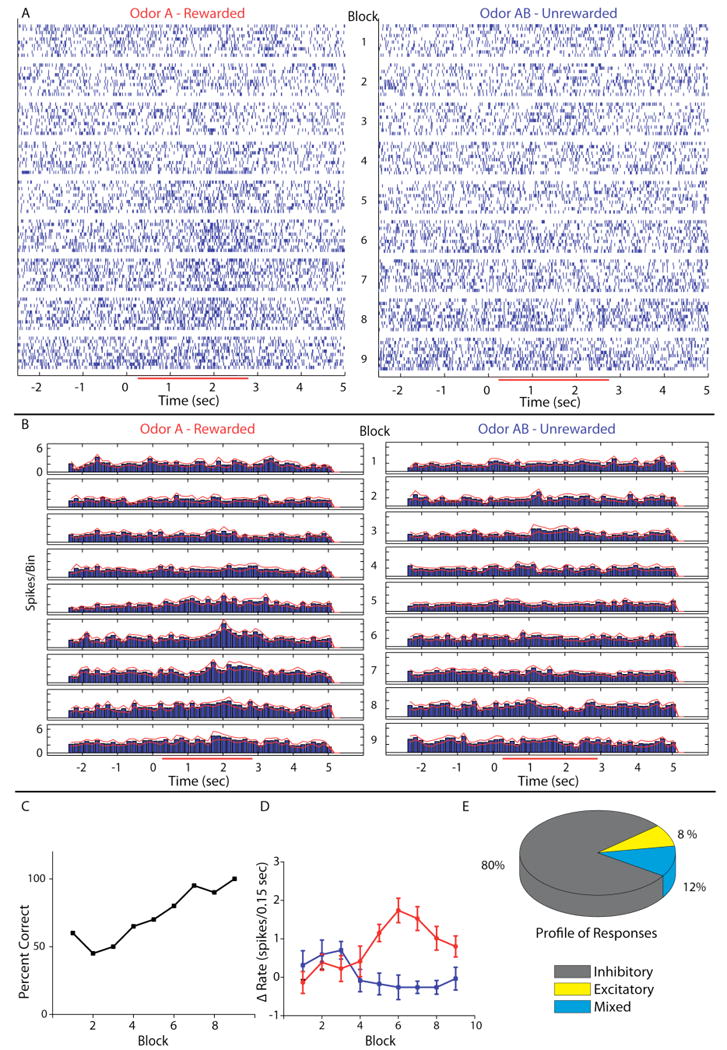
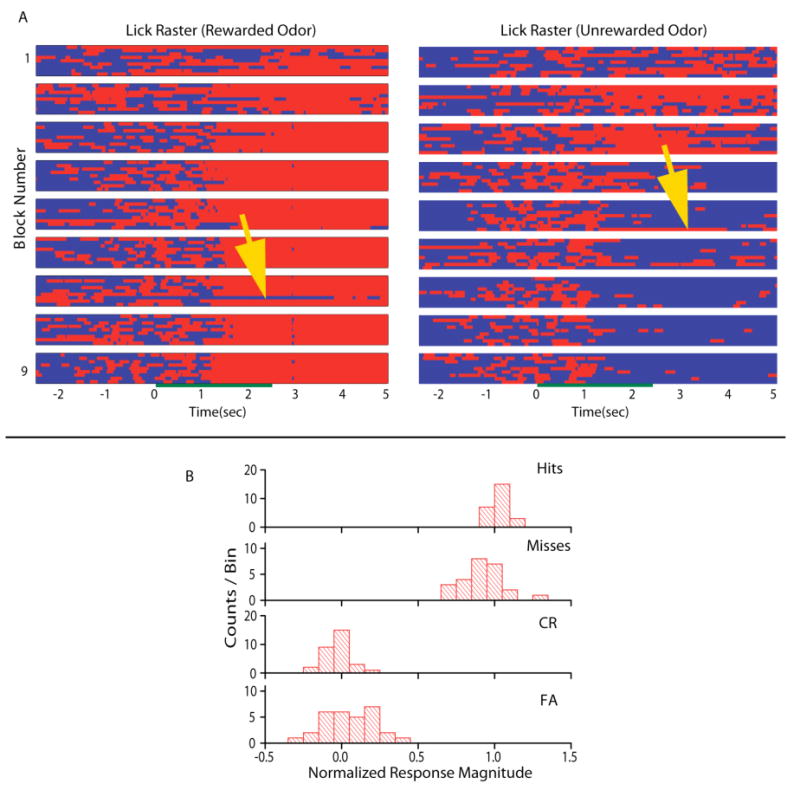
Recent work from our laboratory in awake behaving animals shows that olfactory bulb processing changes depending profoundly on behavioral context. Thus, we find that when recording from the olfactory bulb in a mouse during a go-no go association learning task, it is not unusual to find a mitral cell that initially does not respond to the rewarded or unrewarded odors but develops a differential response to the stimuli during the learning session. This places a challenge on how to approach understanding of olfactory bulb processing, because neural interactions differ depending on the status of the animal. Here we address the question of how the different approaches to study olfactory bulb neuron responses, including studies in anesthetized and unanesthetized animals in vivo and recordings in slices, complement each other. We conclude that more critical understanding of the relationship between the measurements in the different preparations is necessary for future advances in the understanding of olfactory bulb processing of odor information.


Figures

Figure 1
Figure 1
Divergence in single unit responses during learning in the odor discrimination task. A. Raster plot of single unit spike times organized per block for the 10 rewarded trials (A – left column) and 10 unrewarded trials (AB – right column). Timing and duration of odor exposure is indicated on the x-axis by the red bar in the online version and the grayscale bar in the printed version (below we denote the color in the online vs. paper versions as two colors separated by a slash: red/gray). B. Peri-stimulus time histogram (PSTH) of the data shown in A. Red/gray lines on either side of the histogram indicate +/- SEM. The bin size in the PSTH is 0.15 sec. This means that the firing rate in Hz is the value in the Y axis × (1/0.15). C. Behavioral performance – percent correct as a function of block number- for the animal from whom the cell in A and B was recorded. D. A plot of the firing rate increase above background to odor A (red/light gray) and odor AB (blue/black) in each block of the behavior. The points represent the firing rate in spikes/0.15 sec bin during odor exposure (0.5 to 2.5 sec) minus the rate in spikes/0.15 sec bin in the period immediately before odor exposure (-1 to 0 sec). Error bars denote the mean +/- SEM of each point (10 trials per point). E. The lower right hand pie chart shows what percent of the responses were inhibitory (gray/dark gray), excitatory (yellow/light gray) or mixed (blue/medium gray). A mixed response was defined as a response to either odor A or AB that had both an excitatory and inhibitory component or a response that was excitatory to one odor and inhibitory to the other odor stimulus. Taken with permission from Doucette and Restrepo (2008).
Figure 2
Figure 2
Lick and odor responses where the animal made correct or incorrect behavioral responses. A. Trial by trial rasters of lick behavior for the rewarded (odor A – left) and unrewarded (odor AB – right) odors. Red/light gray (online version/paper version) indicates periods of licking and blue/dark gray indicates periods of no licking. Data for ten trials are shown for rewarded and unrewarded odors per block. Blocks are arranged from top to bottom. The green/dark gray bar in the middle of the rasters indicates when the odor was delivered to the chamber. The yellow/light gray arrows point to trials where the animal made a mistake in the lick response. B. Histograms of response magnitude normalized to the average correct rewarded (1) and unrewarded (0) firing rates during the post-stimulus period sorted for the four different types of behavioral outcomes. The normalized response magnitude was calculated for each unit for all blocks in 34 experiments (from 8 animals) where the firing rate differed between unrewarded and rewarded odors in the post-stimulus period, and the animal made at least one incorrect behavioral response. Hits are trials where the animal licks sufficiently to obtain a water reward during a rewarded odor trial. Misses are trials in which the animal fails to lick sufficiently to receive reward on rewarded odor trials. Correct rejections (CR) are trials in which the animal refrains from licking during an unrewarded odor trial. False alarms (FA) are trials in which the animal responds by licking to an unrewarded odor as if it were a rewarded trial. The number of counts per bin represents the number of units displaying a response of a given normalized magnitude. Taken with permission from Doucette and Restrepo (2008).

Similar articles

References

    1. Buck L, Axel R. A novel multigene family may encode odorant receptors: a molecular basis for odor recognition. Cell. 1991;65:175–187. - PubMed
    1. Buck LB. Information coding in the vertebrate olfactory system Annu. Rev Neurosci. 1996;19:517–544. - PubMed
    1. Malnic B, Hirono J, Sato T, Buck LB. Combinatorial receptor codes for odors. Cell. 1999;96:713–723. - PubMed
    1. Johnson BA, Leon M. Chemotopic odorant coding in a mammalian olfactory system. J Comp Neurol. 2007;503:1–34. - PMC - PubMed
    1. Mori K, Takahashi YK, Igarashi KM, Yamaguchi M. Maps of odorant molecular features in the Mammalian olfactory bulb Physiol. Rev. 2006;86:409–433. - PubMed