. 2009 Nov;73(Pt 6):568-81.
doi: 10.1111/j.1469-1809.2009.00538.x. Epub 2009 Aug 16.

Geographical structure of the Y-chromosomal genetic landscape of the Levant: a coastal-inland contrast

Collaborators, Affiliations

Geographical structure of the Y-chromosomal genetic landscape of the Levant: a coastal-inland contrast

Mirvat El-Sibai et al. Ann Hum Genet. 2009 Nov.

Abstract

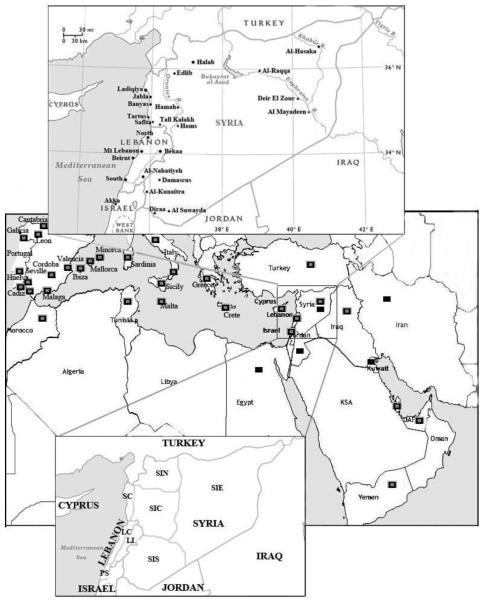
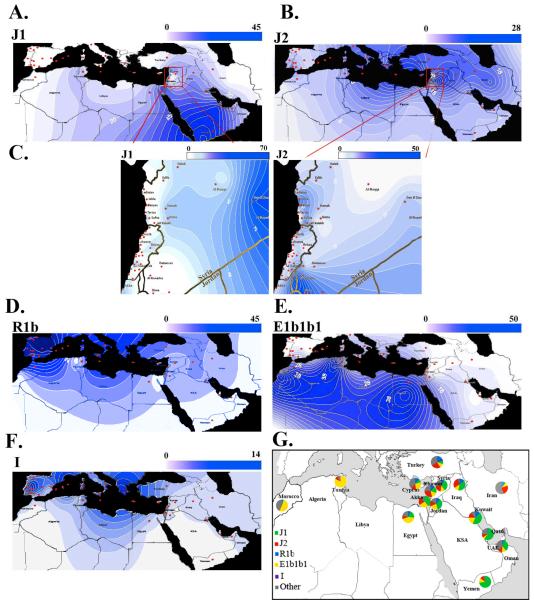
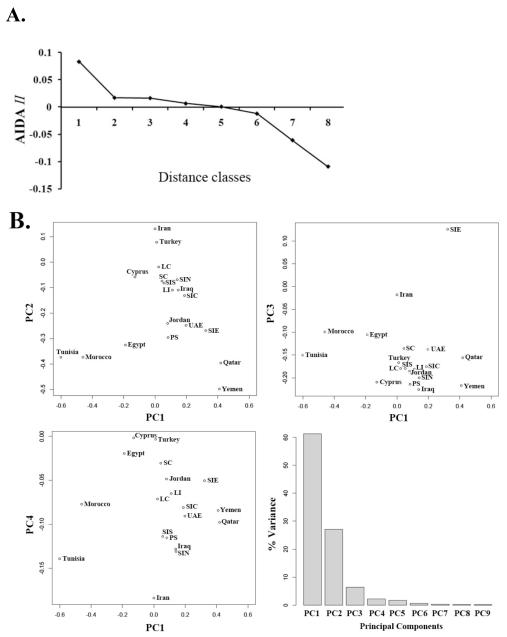
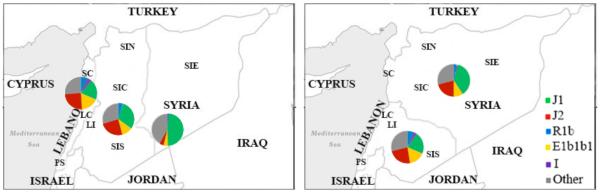
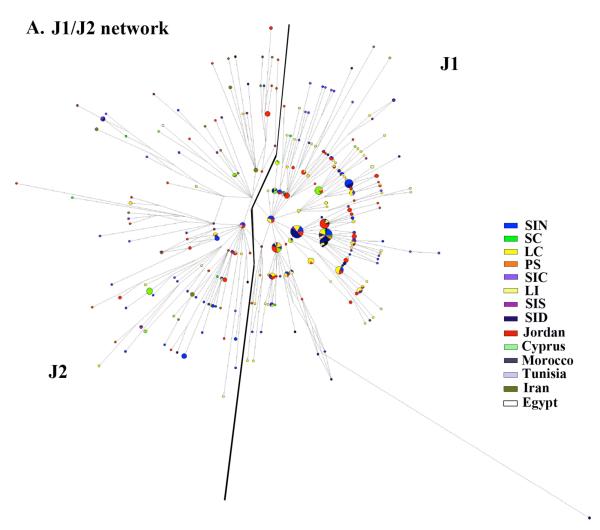
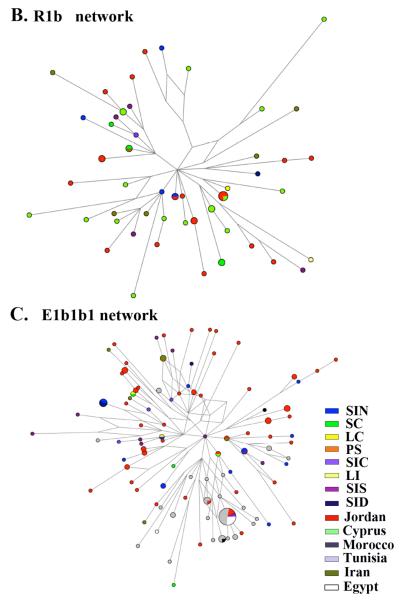
We have examined the male-specific phylogeography of the Levant and its surroundings by analyzing Y-chromosomal haplogroup distributions using 5874 samples (885 new) from 23 countries. The diversity within some of these haplogroups was also examined. The Levantine populations showed clustering in SNP and STR analyses when considered against a broad Middle-East and North African background. However, we also found a coastal-inland, east-west pattern of diversity and frequency distribution in several haplogroups within the small region of the Levant. Since estimates of effective population size are similar in the two regions, this strong pattern is likely to have arisen mainly from differential migrations, with different lineages introduced from the east and west.


Figures

Figure 1
Figure 1. Locations of samples analyzed
The map in the center shows the Middle Eastern and North African countries sampled in the study. The black boxes designate the populations with newly generated data and the gray boxes populations with data obtained from the literature. The Levantine region under study is highlighted in the open box. The upper inset shows the Levantine cities that were sampled and analyzed in this study. The lower inset shows the Levantine area (1,613 samples), as classified here, with Lebanon and Syria subdivided geographically, as detailed in the methods and in Table S3a. LC = Lebanese coast, LI = Lebanese inland, PS = Palestinian samples, SC = Syrian coast, SIN = Syrian inland North, SIC = Syrian inland center, SIS = Syrian inland South, and SIE = Syrian inland East.
Figure 2
Figure 2. Y-chromosomal variation in the Levant and the Mediterranean region. A-F) Haplogroup-frequency contour maps of the Mediterranean region
The haplogroup percentages used for the contour map are shown in Table 1. Each panel shows a different haplogroup: J1 (A), J2 (B), R1b (or R1(xR1a1)-as indicated in Table 1) (D), E1b1b1 (E) and I (F). C) High resolution J1 and J2 frequency contour maps of the Levant. The locations of the cities used the haplogroup frequencies are shown in Table S3c. The scales reflect the percentages of haplogroups, where dark blue is the highest value and white is zero. The filled red circles indicate the sample sites. G) Haplogroup frequency analyses. The data used to make the pie charts are shown in Table 1.
Figure 3
Figure 3. Analysis of binary marker data in Middle-Eastern and North African populations
A) Correlogram of the AIDA II indices and B) Principal component analysis. The data are the haplogroup frequencies in the Middle-Eastern and North-African countries (Table 1) and in the Levantine regions as defined in Table S3a (Table S1 and S2). The principal component variances are shown in the bar graph in the last panel
Figure 4
Figure 4. Coastal/inland and north/south classifications of haplogroup frequencies in the Levant
The Levantine regions (Table S3a) were grouped in two ways and their haplogroup frequencies presented in pie charts. The right hand panel shows the North/South grouping. The left hand panel shows cost/inland grouping, where the regions were split into coastal cities, center regions and deep inland regions. The data used to make the pie charts are shown in Table 2A. The legend explains the color coding for the different haplogroups used in the pie charts.
Figure 5
Figure 5. Network analysis
Reduced-median networks were constructed for the following haplogroups, J1 and J2 (A), R1b (B), and E1b1b1 (C). Networks were constructed from 10 STRs (Table S1 and S2) as described in materials and methods. For each network, the smallest circles represent a count of one individual. Branch lengths are proportional to the number of mutational steps separating two haplotypes.

References

    1. Adams SM, Bosch E, Balaresque PL, Ballereau SJ, Lee AC, Arroyo E, Lopez-Parra AM, Aler M, Grifo MS, Brion M, Carracedo A, Lavinha J, Martinez-Jarreta B, Quintana-Murci L, Picornell A, Ramon M, Skorecki K, Behar DM, Calafell F, Jobling MA. The genetic legacy of religious diversity and intolerance: paternal lineages of Christians, Jews, and Muslims in the Iberian Peninsula. Am J Hum Genet. 2008;83:725–36. - PMC - PubMed
    1. Akarli ED. The Long Peace: Ottoman Lebanon, 1861-1920. I.B. Tauris; London: 1993.
    1. Al-Zahery N, Semino O, Benuzzi G, Magri C, Passarino G, Torroni A, Santachiara-Benerecetti AS. Y-chromosome and mtDNA polymorphisms in Iraq, a crossroad of the early human dispersal and of post-Neolithic migrations. Mol Phylogenet Evol. 2003;28:458–72. - PubMed
    1. Arredi B, Poloni ES, Paracchini S, Zerjal T, Fathallah DM, Makrelouf M, Pascali VL, Novelletto A, Tyler-Smith C. A predominantly neolithic origin for Y-chromosomal DNA variation in North Africa. Am J Hum Genet. 2004;75:338–45. - PMC - PubMed
    1. Aubet M-E. The Phoenicians and the West: Politics, Colonies and Trade. Cambridge University Press; Cambridge: 1993.

Publication types