. 2009 Aug 17:4:32.
doi: 10.1186/1749-8104-4-32.

Dynamic Pax6 expression during the neurogenic cell cycle influences proliferation and cell fate choices of retinal progenitors

Affiliations

Dynamic Pax6 expression during the neurogenic cell cycle influences proliferation and cell fate choices of retinal progenitors

Yi-Wen Hsieh et al. Neural Dev. .

Abstract

Background: The paired homeobox protein Pax6 is essential for proliferation and pluripotency of retinal progenitors. However, temporal changes in Pax6 protein expression associated with the generation of various retinal neurons have not been characterized with regard to the cell cycle. Here, we examine the dynamic changes of Pax6 expression among chicken retinal progenitors as they progress through the neurogenic cell cycle, and determine the effects of altered Pax6 levels on retinogenesis.

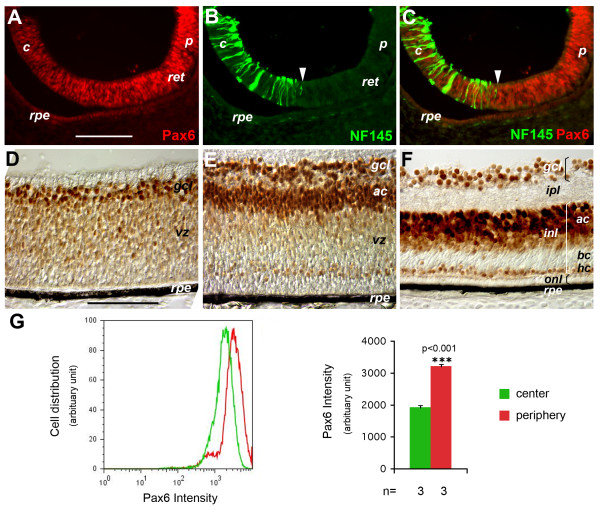
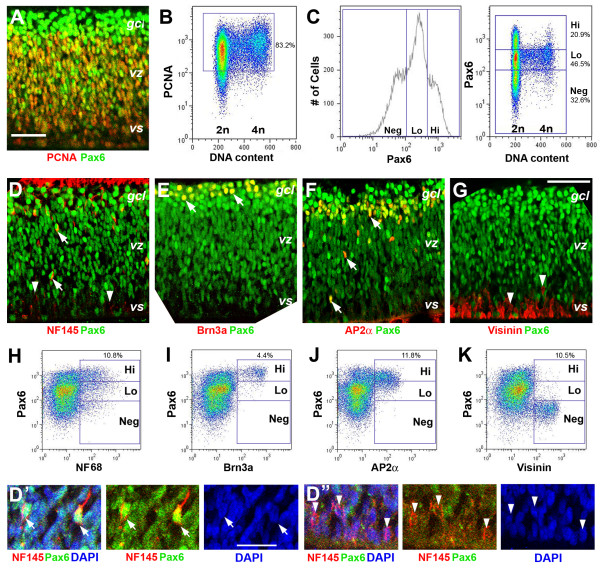
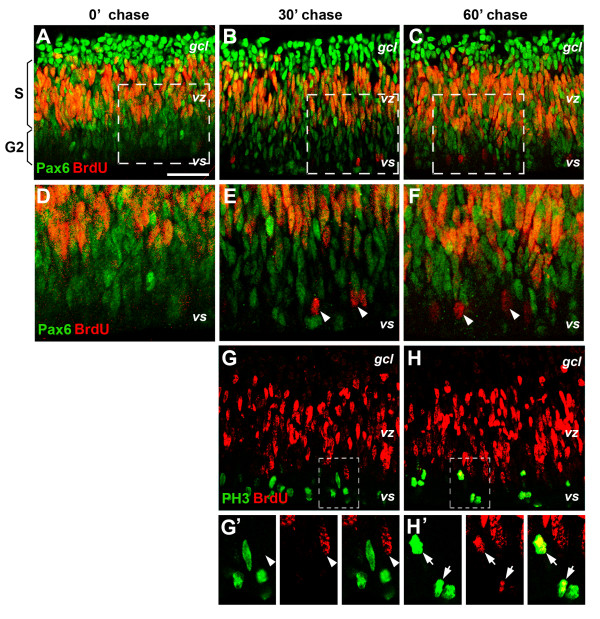
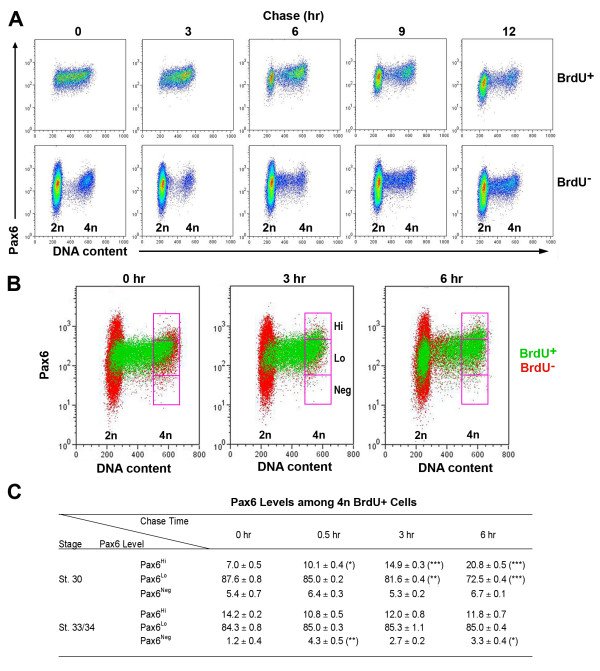
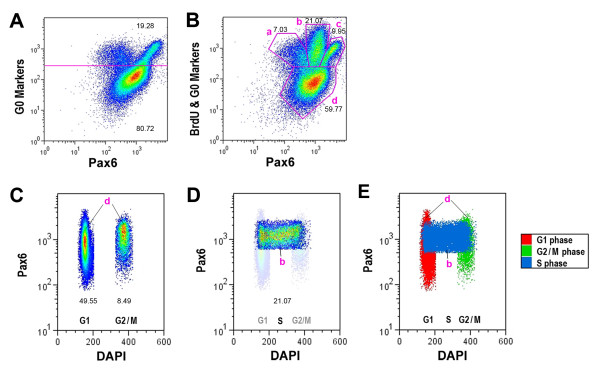
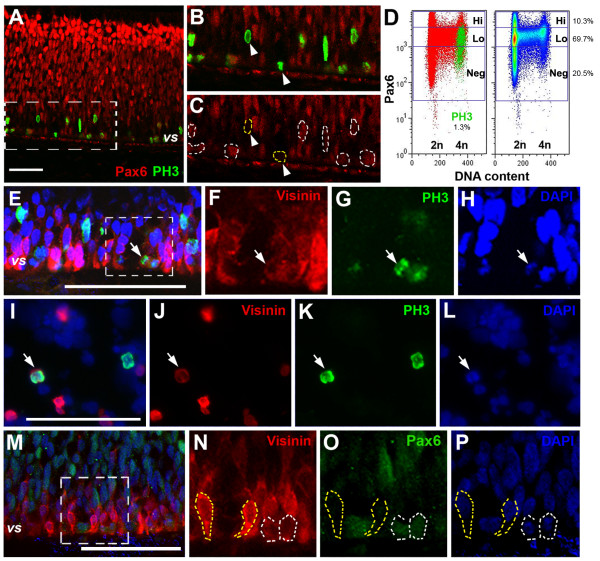
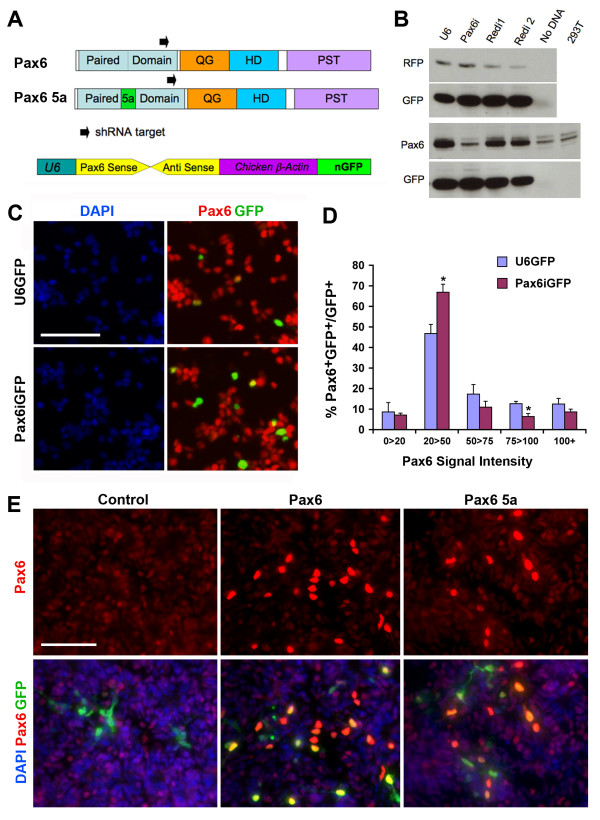
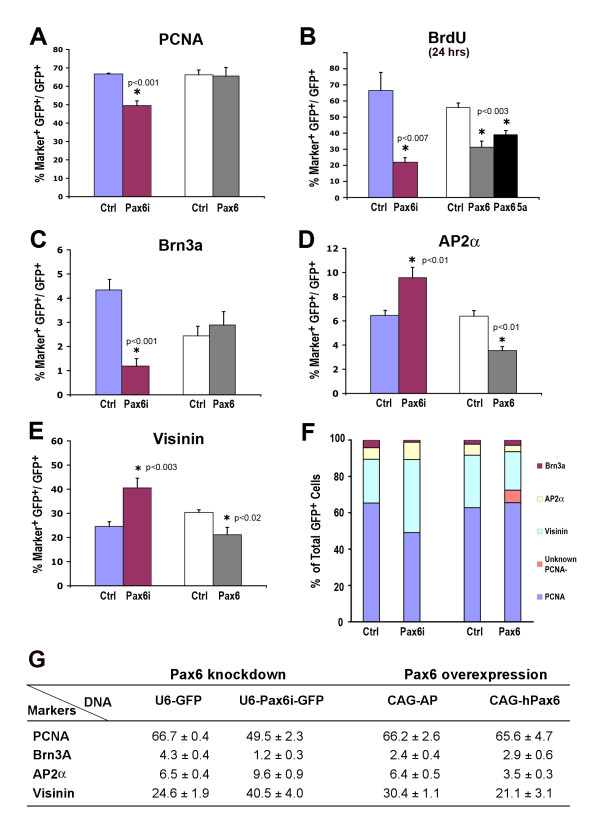
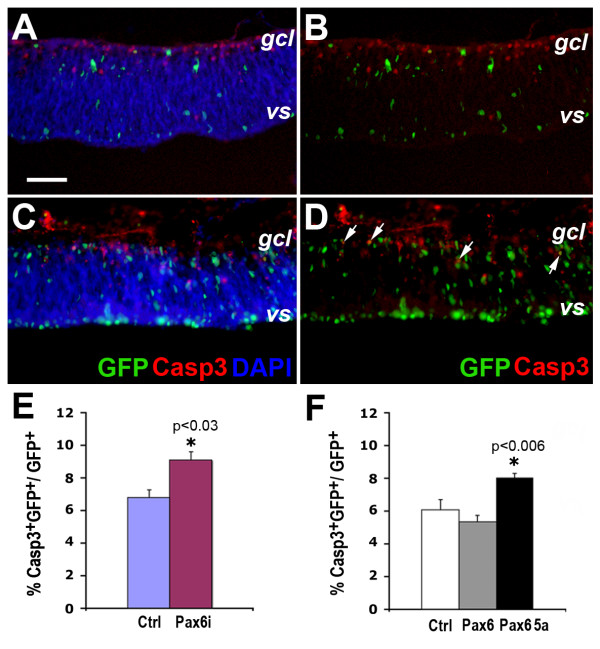
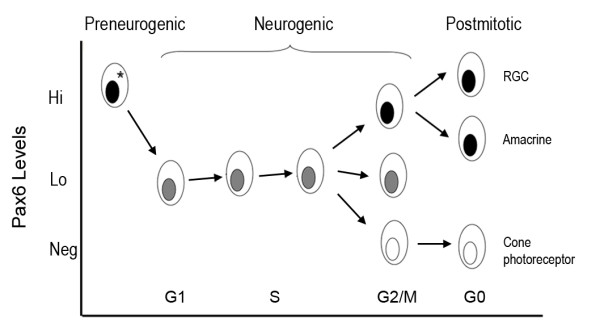
Results: We provide evidence that during the preneurogenic to neurogenic transition, Pax6 protein levels in proliferating progenitor cells are down-regulated. Neurogenic retinal progenitors retain a relatively low level of Pax6 protein, whereas postmitotic neurons either elevate or extinguish Pax6 expression in a cell type-specific manner. Cell imaging and cell cycle analyses show that neurogenic progenitors in the S phase of the cell cycle contain low levels of Pax6 protein, whereas a subset of progenitors exhibits divergent levels of Pax6 protein upon entering the G2 phase of the cell cycle. We also show that M phase cells contain varied levels of Pax6, and some correlate with the onset of early neuronal marker expression, forecasting cell cycle exit and cell fate commitment. Furthermore, either elevating or knocking down Pax6 attenuates cell proliferation and results in increased cell death. Reducing Pax6 decreases retinal ganglion cell genesis and enhances cone photoreceptor and amacrine interneuron production, whereas elevating Pax6 suppresses cone photoreceptor and amacrine cell fates.

Conclusion: These studies demonstrate for the first time quantitative changes in Pax6 protein expression during the preneurogenic to neurogenic transition and during the neurogenic cell cycle. The results indicate that Pax6 protein levels are stringently controlled in proliferating progenitors. Maintaining a relatively low Pax6 protein level is necessary for S phase re-entry, whereas rapid accumulation or reduction of Pax6 protein during the G2/M phase of the cell cycle may be required for specific neuronal fates. These findings thus provide novel insights on the dynamic regulation of Pax6 protein among neurogenic progenitors and the temporal frame of neuronal fate determination.


Figures

Figure 1
Figure 1
Expression patterns of Pax6 in the developing chicken retina. (A-G) Expression of Pax6 protein during the preneurogenic to neurogenic transition (A-C, G) and subsequent neurogenesis (D-F). (A-C) Immunofluorescent images of E4.5 (HH stage 24) retinas labeled for Pax6 (A), NF145 (B), and the merge of the two (C). White arrowheads in (B, C) indicate the neurogenic wave front. (D-F) Immunohistochemical images of E6.5 (HH stage 30) (D), E7 (HH stage 32) (E), and E12 (HH stage 38) (F) retinas. ac, amacrine cells; bc, bipolar cells; c, central retina; gcl, ganglion cell layer; hc, horizontal cells; inl, inner nuclear layer; ipl, inner plexiform layer; onl, outer nuclear layer; p, peripheral retina; ret, retina; rpe, retinal pigment epithelium; vz, ventricular zone. Scale bars: 100 μm; scale bar in (A) applies to (A-C), and in (D) to (D-F). (G) Quantification of Pax6 protein levels in the preneurogenic and neurogenic regions. E4.5 (HH stage 25) eyes were cut at the equator to separate the central and peripheral portions. Dissociated retinal cells from the two portions were subjected to flow cytometric analyses to quantify Pax6 protein on a per cell basis. A representative cell distribution profile with regard to Pax6 levels is shown on the left. Average Pax6 levels for the central and peripheral retinal cells (N = 3, mean ± standard error) are shown on the right. Green, central; red, peripheral. ***P < 0.001.
Figure 2
Figure 2
Distinct Pax6 expression levels among progenitors and postmitotic neurons. Immunocytochemical and flow cytometric analyses of neurogenic retinas. (A) Merged confocal image of PCNA (red) and Pax6 (green) co-labeled E6.5 (HH stage 30) retina. (B) Flow cytometry profile of E6 retinal cells based on PCNA signal and DNA content. The positions of 2n and 4n DNA contents indicate cells residing in the G1/G0 (2n) or G2/M (4n) phase. S phase cells are positioned between 2n and 4n along the DNA content axis. PCNA+ cells (boxed, 83.2% of total cells) are distributed throughout the cell cycle. (C) Flow cytometry profiles for Pax6 levels of total cells (left panel) and Pax6 versus DNA content (right panel) at E7 (HH stage 32). Blue lines delineate Pax6Hi (20.9%), Pax6Lo (46.5%), and Pax6Neg (32.6%) cell popuations. (D-G) Merged confocal images of E6.5 (HH stage 30) retinas co-labeled for Pax6 and NF145 (D), Brn3a (E), AP2α (F), or Visinin (G). (D', D") Higher magnification images of NF145 and Pax6 co-labeling near the ventricular surface. Arrows indicate co-labeled cells. Arrowheads point to marker-positive but Pax6-negative cells. (H-K) Flow cytometry profiles of Pax6 and NF68 (H), Brn3a (I), AP2α (J), and Visinin (K) at E7 (HH stage 32). Boxed regions delineate distribution of neuronal marker-positive cells according to Pax6 levels. Percentages of marker-positive cells among total cells are shown above the boxes. gcl, ganglion cell layer; vs, ventricular surface; vz, ventricular zone. Scale bars: 100 μm in (A, G), which applies to (D-G); 50 μm in (D'), which applies to (D', D").
Figure 3
Figure 3
Pax6 expression during S, G2 and M phase of the cell cycle. Merged confocal immunofluorescent images of E6.5 (HH stage 30) retinas after a 20-minute bromodeoxyuridine (BrdU) pulse label in vitro. (A-F) Co-staining of BrdU and Pax6 at 0 (A, D), 30 (B, E), and 60 minutes (C, F) after the pulse label. The boxed regions in (A-C) are shown in (D-F), respectively, at twofold magnification. Note the appearance of BrdU+ cells at the ventricular surface by the 30-minute chase time. (G, G', H, H') Co-staining of phospho-histone 3 (PH3) and Pax6 at 30 (G, G') or 60 minutes (H, H') after the pulse label. The boxed regions in (G, H) are shown as separate panels in (G', H'), respectively, at twofold magnification. Note the appearance of BrdU+PH3+ double-labeled cells at the ventricular surface by the 60-minute chase time. Arrows indicate BrdU and PH3 co-labeled cells. Arrowheads point to BrdU+ cells. gcl, ganglion cell layer; vs, ventricular surface; vz, ventricular zone. Scale bar: 100 μm; the scale bar in (A) applies to (A-C, G, H).
Figure 4
Figure 4
Divergence of Pax6 protein expression in the G2/M phase of the cell cycle. (A) Flow cytometric analyses of BrdU, Pax6, and DNA content among E6.5 (HH stage 30) retinal cells after a 20-minute BrdU pulse labeling. Cell density profiles of BrdU+ (upper row) and BrdU- (lower row) cells at various post-chase times are shown. The 0 hour point represents the time when cells are dissociated after the pulse label and then fixed and processed for flow cytometry. Each data point represents a minimum of 30,000 cells analyzed. The x-axis represents DNA content for G0/G1 (2n), S (between 2n and 4n), and G2/M (4n) phase cells. (B) Merged flow cytometry profiles for BrdU+ (green) and BrdU- (red) cells at 0, 3, and 6 hours post-BrdU pulse labeling. The purple frames subdivide G2/M phase cells (4n) according to Pax6 levels into high (Hi), low (Lo), and negative (Neg) categories. Between 0 and 6 hours of chasing, Pax6Hi cells clearly increased, demonstrating the Pax6 level divergence when cells enter the G2/M phase. (C) Quantification of Pax6 levels at stage 30 (E6.5) and stage 33/34 (E7.5 to 8) among BrdU+ cells that had entered G2/M phase (4n) as shown in the three boxed regions in (B). The percentages of 4n BrdU+ cells with Pax6Hi, Pax6Lo, or Pax6Neg levels among total 4n BrdU+ cells at various post-chase times are shown (N = 3; mean ± standard error). Asterisks represent P-values between 0 hours and various chase time points: *P < 0.05; **P < 0.01; ***P < 0.001.
Figure 5
Figure 5
Correlation of Pax6 levels in progenitors in different phases of the cell cycle. Flow cytometric analyses of Pax6 levels among postmitotic cells and cycling progenitor cells at E7 (HH stage 32). (A) Cell density profile of total retinal cells labeled with Pax6 and a combination of neuronal markers, including Brn3a, Islet1/2, AP2a, and Visinin. Neuronal marker-positive cells (above the purple line) represent G0 cells; and neuronal marker-negative cells (below the purple line) are mostly progenitor cells. (B) Cell density profile of total retinal cells labeled with a combination of neuronal markers (same as in (A)), BrdU, and Pax6. Gated areas 'a' and 'c' represent postmitotic G0 phase cells; gated area 'b' represents BrdU+ S phase cells; gated area 'd' consists of G1, G2, and M phase cells. (C, D) Cell density profiles of G1 and G2/M phase cells (C) (as gated in area 'd') and S phase cells (D) (as gated in area 'b' in (B)) according to Pax6 levels and DNA content. In (D), G1 and G2/M cells are shown in the background as a reference to S phase cells. (E) Merged flow cytometry profiles of G1 (red), G2/M (green), and S (blue) phase progenitor cells according to Pax6 levels and DNA content. Flow cytometry profiles shown in (A, B) were generated with >85,000 cells. Numbers within each panel indicate percentage of gated cells among total cells.
Figure 6
Figure 6
Correlation of Pax6 changes in G2/M phase with the emergence of a neuronal marker. (A-C) Confocal images of Pax6 and PH3 co-labeling at E6.5 (HH stage 30). Boxed region in (A) is shown as Pax6 and PH3 merge (B) or Pax6 alone (C) at twofold magnification, where dotted outlines in (C) encircle all PH3+ cells. (D) Flow cytometry profiles of Pax6, PH3, and DNA content at E7 (HH stage 32). For both panels the y-axes represent Pax6 levels, while the x-axes indicate the DNA content. The left panel shows merged distribution profiles of Pax6 (red) and PH3 (green), and the percentage of PH3+ cells among total cells is indicated below. The right panel shows cell density distribution with regard to Pax6 and the cell cycle. The percentages of Pax6Hi, Pax6Lo, and Pax6Neg cells among total cells are indicated at the right. (E-H) Confocal images of Visinin, PH3, and DAPI co-staining at E6.5 (HH stage 30). The boxed region in (E) is shown as Visinin- (F), PH3- (G), or DAPI staining (H) alone at twofold magnification. (I-L) Co-labeling for Visinin (J), PH3 (K), DAPI (L), and merge (I) in dissociated E6 retina cells. (M-P) Confocal images of Visinin, Pax6, and DAPI co-staining at E6.5 (HH stage 30). The boxed region in (M) is shown as Visinin (N), Pax6 (O), or DAPI staining (P) alone at twofold magnification. Yellow dotted lines encircle Visinin+Pax6Neg cells, whereas white dotted lines in (N-P) encircle a pair of cells at the end of the M-phase with weak Pax6 and Visinin signals. Arrows indicate co-labeled cells. Arrowheads point to marker-positive but Pax6- cells. vs, ventricular surface. Scale bars: 100 μm.
Figure 7
Figure 7
Effectiveness of Pax6 knockdown and overexpression. (A) Schematics show small hairpin RNA (shRNA) target location in Pax6 and Pax6 5a and the structure of the U6 shRNA construct (bottom). (B) Western blots show Pax6 shRNA knockdown in transfected 293T cells. DNAs used are listed on the top and antibodies used are on the left of the blots. U6, control vector used to express shRNA; Pax6i, U6 vector expressing shRNA targeting Pax6; Redi1 and Redi2, U6 vectors expressing shRNAs targeting red fluorescent protein (RFP). (C) Immunolabeling shows Pax6 protein knockdown in transfected E4.5 (HH stage 24) retinal cells after 2 days in vitro (DIV). Pax6i transfected samples showed fewer cells co-expressing green fluorescent protein (GFP) and Pax6. (D) Quantification of Pax6 protein signal intensities among U6 vector and U6-Pax6i vector transfected E4.5 retinal cells after 2 DIV. Asterisks represent P-values between the control and the Pax6i samples: *P < 0.05 (N ≥ 4, mean ± standard error). (E) Immunofluorescent staining of E5 (HH stage 27) retinal cells transfected with CAG control vector and Pax6 or Pax6(5a) overexpression vectors after 2 DIV. Note both Pax6 and Pax6(5a) expression vector-transfected cells show higher Pax6 expression levels than endogenous Pax6 levels observed in retinal cells.
Figure 8
Figure 8
Effects of altering Pax6 expression on cell proliferation and fate specification. Chicken retinal explants were transfected with Pax6 shRNA expression or Pax6 overexpression vectors at E4.5 (HH stage 24). Cell marker assays were performed after 3 days in vitro. Statistically significant sample pairs are indicated with asterisks and specific P-values (N ≥ 4). (A-E) Bar graphs showing percentages of cell marker and green fluorescent protein (GFP) double positive cells over total GFP+ transfected cells. (F) Compilation of cell type markers among all transfected GFP+ cells under control and Pax6 perturbation conditions. The mean values were used to generate the graph. (G) Summary of the percentages of cell markers and deviations (N ≥ 4, mean ± standard error) under controls and Pax6 knockdown or Pax6 overexpression conditions. BrdU, bromodeoxyuridine; PCNA, proliferating cell nuclear antigen.
Figure 9
Figure 9
Effects of altering Pax6 expression on cell death. (A-D) Immunofluorescent images of retinal explants transfected at E4.5 (HH stage 24) with U6 control (A, B) and U6-Pax6i (C, D) vectors after 2 days in vitro. (A, C) Merged images for green fluorescent protein (GFP), activated caspase 3 (Casp3, red), and DAPI. (B, D) Merged images showing GFP+ transfected cells and Casp3+ signals. Note that Pax6i-transfected retinas show higher levels of apoptosis than the U6 control. Arrows in (D) indicate cells co-labeled for GFP and Casp3. (E, F) Quantification of Casp3+ cells among GFP+-transfected cells in dissociated E5 (HH stage 27) retinal cell cultures after 2 days in vitro. Statistically significant data points between the controls and given samples are indicated with asterisks and specific P-values (N = 3, mean ± standard error). gcl, ganglion cell layer; vs, ventricular surface.
Figure 10
Figure 10
Pax6 expression during cell cycle progression and a model of cell cycle-dependent Pax6 regulation. A model of dynamic Pax6 expression during retinogenesis is depicted. Pax6 protein levels decrease in progenitor cells during the transition from the preneurogenic (indicated with an asterisk) to the neurogenic stage. Neurogenic progenitors express low levels of Pax6 protein, which is essential for maintaining the proliferative state, especially the reentry of S phase. The cohort of S phase cells contains a relatively uniform level of low Pax6. Upon entering into the G2/M phase, the neurogenic progenitor population displays more divergent Pax6 levels, with a subset of progenitor cells showing increased or decreased Pax6 protein expression depending on the developmental stage. Because postmitotic neurons contain distinct levels of Pax6 protein, the divergence of Pax6 expression during the G2/M phase may forecast cell fate specification at or prior to the G2 phase of the cell cycle. Postmitotic neurons achieve and maintain specific and distinct levels of Pax6 during differentiation. RGC, retinal ganglion cell.

Similar articles

Cited by

References

    1. Glaser T, Walton DS, Maas RL. Genomic structure, evolutionary conservation and aniridia mutations in the human PAX6 gene. Nat Genet. 1992;2:232–239. doi: 10.1038/ng1192-232. - DOI - PubMed
    1. Halder G, Callaerts P, Gehring WJ. Induction of ectopic eyes by targeted expression of the eyeless gene in Drosophila. Science. 1995;267:1788–1792. doi: 10.1126/science.7892602. - DOI - PubMed
    1. Gehring WJ. New perspectives on eye development and the evolution of eyes and photoreceptors. J Hered. 2005;96:171–184. doi: 10.1093/jhered/esi027. - DOI - PubMed
    1. Ashery-Padan R, Gruss P. Pax6 lights-up the way for eye development. Curr Opin Cell Biol. 2001;13:706–714. doi: 10.1016/S0955-0674(00)00274-X. - DOI - PubMed
    1. Quiring R, Walldorf U, Kloter U, Gehring WJ. Homology of the eyeless gene of Drosophila to the Small eye gene in mice and Aniridia in humans. Science. 1994;265:785–789. doi: 10.1126/science.7914031. - DOI - PubMed

Publication types

MeSH terms