. 2009 Aug 19;97(4):1095-103.
doi: 10.1016/j.bpj.2009.05.039.

On the use of Ripley's K-function and its derivatives to analyze domain size

Affiliations

On the use of Ripley's K-function and its derivatives to analyze domain size

Maria A Kiskowski et al. Biophys J. .

Abstract

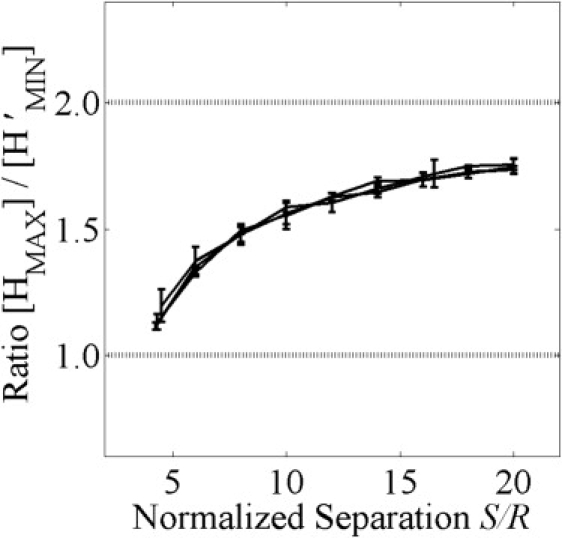
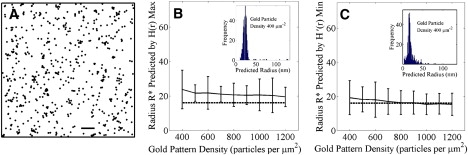
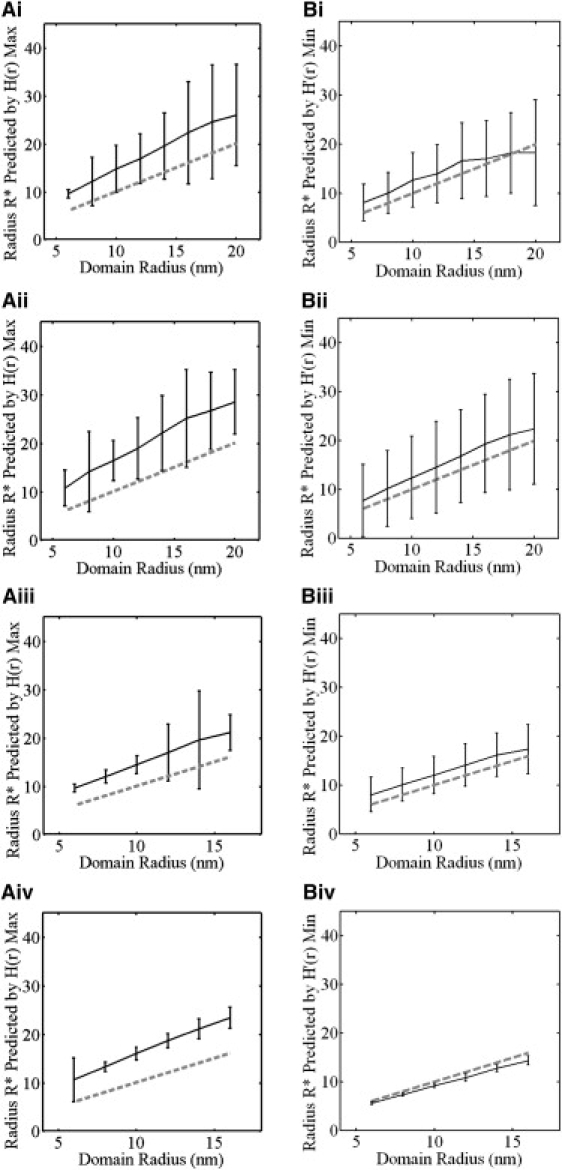
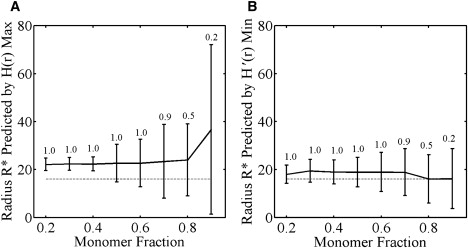
Ripley's K-, H-, and L-functions are used increasingly to identify clustering of proteins in membrane microdomains. In this approach, aggregation (or clustering) is identified if the average number of proteins within a distance r of another protein is statistically greater than that expected for a random distribution. However, it is not entirely clear how the function may be used to quantitatively determine the size of domains in which clustering occurs. Here, we evaluate the extent to which the domain radius can be determined by different interpretations of Ripley's K-statistic in a theoretical, idealized context. We also evaluate the measures for noisy experimental data and use Monte Carlo simulations to separate the effects of different types of experimental noise. We find that the radius of maximal aggregation approximates the domain radius, while identifying the domain boundary with the minimum of the derivative of H(r) is highly accurate in idealized conditions. The accuracy of both measures is impacted by the noise present in experimental data; for example, here, the presence of a large fraction of particles distributed as monomers and interdomain interactions. These findings help to delineate the limitations and potential of Ripley's K in real-life scenarios.


Figures

Figure 1
Figure 1
Distribution of idealized domains and distribution of points. (A) Disk-shaped domains of radius R are tiled on a square lattice in a triangular pattern with periodic boundary conditions. The distance between the centers of any two adjacent domains is S. The distance between neighboring domain edges is S − 2R. (B) A random snapshot of a distribution of points (black pixels) with density 0.05 nm−2 within domains and 0.001 nm−2 outside of domains. The horizontal bar indicates 10 nm. Domains have radius R = 20 nm and are separated by S = 120 nm.
Figure 2
Figure 2
Using Ripley's H-function to identify domain radius. (A) H(r) for a random (Poisson) distribution (dotted line), points entirely clustered within 25 domains of radius R = 20 nm separated by S = 100 nm (black solid line), or points clustered in domains in the presence of a monomer fraction (gray solid line). The arrow labeled “HMAX” indicates where H(r) is maximized and the arrow labeled “H′MIN” indicates where the slope of H(r) is first −1 for the entirely clustered distribution. To simulate a monomer fraction, nodes outside domains were populated at a density of 1 × 10⁻³ probes nm−2. (B) H(r) calculated for three distributions containing 25 domains with a constant domain radius of 20 nm but varied domain separation (100, 200, or 300 nm). Note that the magnitude and position of [HMAX] shifts systematically with the domain separation (solid black circles indicated by arrows). (C) The domain radius R predicted by [HMAX] as a function of the domain separation. The domain radius and diameter are indicated by the dashed gray lines at 20 nm and 40 nm, respectively. Data represent the mean ± SD for five independent point distributions containing 25 domains of radius R = 20 nm.
Figure 3
Figure 3
Taking the derivative of H(r) removes accumulative effects. (A) H′(r) calculated for idealized distributions containing 25 domains with radius R of 20 nm for three different values of domain separation S: 100 nm (open triangles), 200 nm (open squares), or 300 nm (open circles). (B) The domain radius R predicted by [HMIN] (squares) as a function of the domain separation. The domain radius and diameter are indicated by the dashed gray lines at 20 nm and 40 nm, respectively. In both panels, data represent the mean ± SD for five independent point distributions containing 25 domains of radius R = 20 nm.
Figure 4
Figure 4
Using Ripley's L-function and its derivative to identify domain radius. (A) L(r) and (B) L′(r) for a random (Poisson) distribution (dotted line), points entirely clustered within domains (black solid line), or points clustered in domains in the presence of a monomer fraction (gray solid line). The arrow indicates where the slope of L(r) is first 0 for the entirely clustered distribution. Data represent the mean ± SD for five independent point distributions containing 25 domains of radius R = 20 nm and separation S = 60 nm. To simulate a monomer fraction, nodes outside domains were populated at a density of 1 × 10⁻³ probes nm−2.
Figure 5
Figure 5
Ratio [HMAX]/[HMIN] increases monotonically with the domain separation. The ratio [HMAX]/[HMIN] versus the separation S is the same for three different domain radii if the domain separation is normalized by the domain radius R. The domain radii are 20 nm, 30 nm, and 40 nm for the three plots shown, indistinguishable within error. Data represent the mean ± SD for five independent point distributions containing 25 domains of radius R = 20 nm.
Figure 6
Figure 6
Nanocluster radius for Monte Carlo simulations of K-ras nanoclusters as a function of pattern density. (A) Example of an experimentally derived point pattern with an immunogold density of 625 μm−2. Data are representative of those collected for K-ras in Plowman et al. (17). Scale bar = 100 nm. (B and C) Radii calculated for 500 simulated point patterns mimicking K-ras nanoclusters. The dashed line shows the actual domain radius (16 nm) whereas the solid line shows the mean and SD of Ripley's calculations for (B) the radius calculated using the max value of H(r), or (C) the radius calculated using the min value of H′(r). Histograms (insets) show the distribution of individual simulation predictions when the gold pattern density is 400 particles/μm2.
Figure 7
Figure 7
Analysis of the contribution of monomer fraction and domain interaction to estimates of K-ras domain radius obtained from [HMAX] or [HMIN]. Simulated point patterns were generated as in Fig. 6 except that the domain radius was systematically varied from 6 nm to 16 or 20 while holding the particle density constant at 612 particles per 1000 nm × 1000 nm. The domain radius was calculated using the max value of H(r) (A panels) or using the minimum values of H′(r) (B panels). Monte Carlo point patterns were generated with both noise sources (Ai and Bi), with domain interaction but no monomer fraction (Aii and Bii), with a monomer fraction but without domain interaction (Aiii and Biii) and without either a monomer fraction or domain interaction (Aiv and Biv). The dotted line shows the actual domain radius, whereas the solid line with error bars shows the mean radius and SD of 500 point patterns.
Figure 8
Figure 8
Ripley's-K predictions as the monomer fraction is varied. Ripley's calculations of domain radii for 500 simulated point patterns with a particle density of 400 particles/μm2, 3.2 particles per domain, domain radius of 16 nm, and varied ratio of monomers to domain particles. (A) Radius calculated using the max value of H(r). (B) Radius calculated using the min value of H′(r). The dashed line shows the actual domain radius (16 nm) whereas the solid line shows the calculated radius. The number associated with each data point indicates the fraction of patterns in which aggregation was identified.

References

    1. Jacobson K., Mouritsen O.G., Anderson R.G. Lipid rafts: at a crossroad between cell biology and physics. Nat. Cell Biol. 2007;9:7–14. - PubMed
    1. Prior I.A., Muncke C., Parton R.G., Hancock J.F. Direct visualization of Ras proteins in spatially distinct cell surface microdomains. J. Cell Biol. 2003;160:165–170. - PMC - PubMed
    1. Sharma P., Varma R., Sarasij R.C., Ira, Gousset K. Nanoscale organization of multiple GPI-anchored proteins in living cell membranes. Cell. 2004;116:577–589. - PubMed
    1. Hess S.T., Kumar M., Verma A., Farrington J., Kenworthy A. Quantitative electron microscopy and fluorescence spectroscopy of the membrane distribution of influenza hemagglutinin. J. Cell Biol. 2005;169:965–976. - PMC - PubMed
    1. Parton R.G., Hancock J.F. Lipid rafts and plasma membrane microorganization: insights from Ras. Trends Cell Biol. 2004;14:141–147. - PubMed

Publication types

LinkOut - more resources