. 2009 Nov;19(11):1963-73.
doi: 10.1101/gr.093047.109. Epub 2009 Aug 17.

Elucidation of the ELK1 target gene network reveals a role in the coordinate regulation of core components of the gene regulation machinery

Affiliations

Elucidation of the ELK1 target gene network reveals a role in the coordinate regulation of core components of the gene regulation machinery

Joanna Boros et al. Genome Res. 2009 Nov.

Abstract

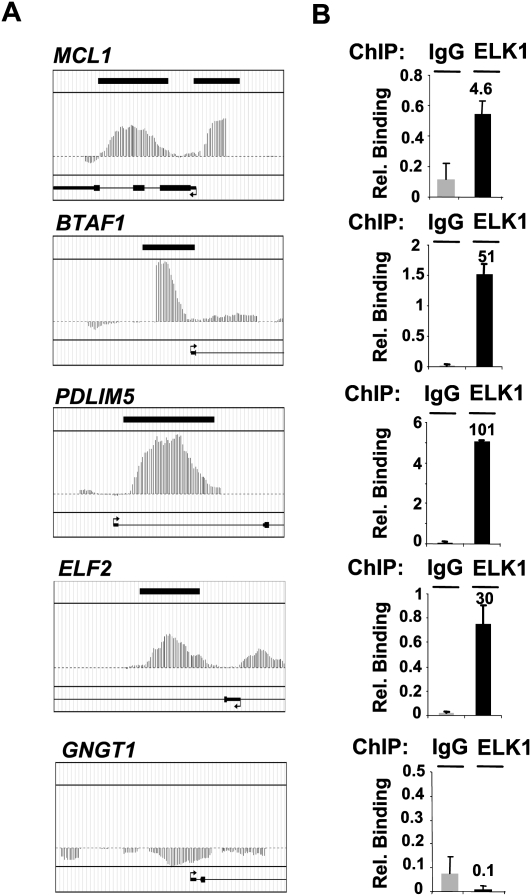
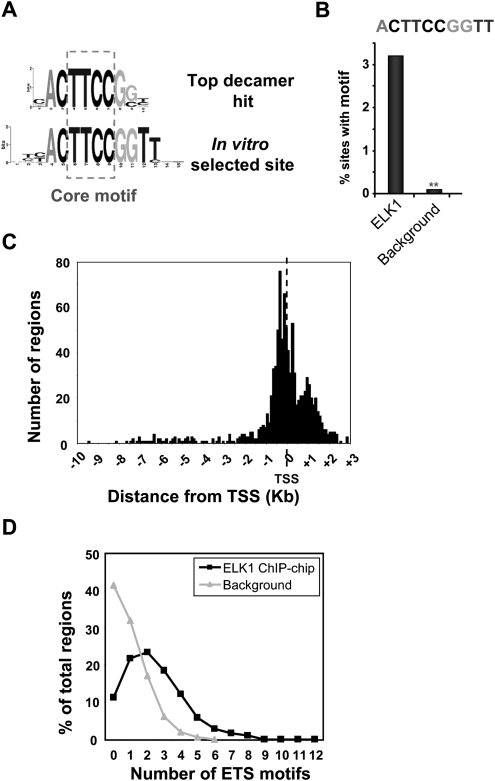
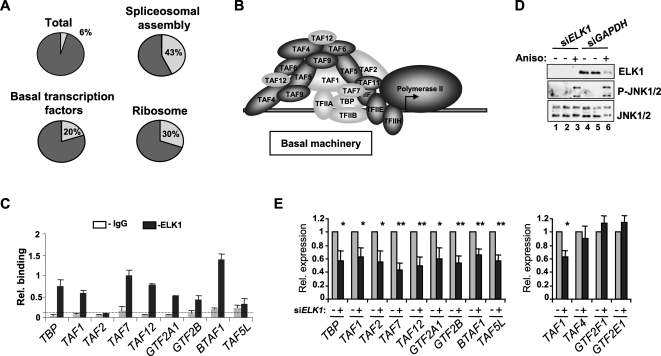
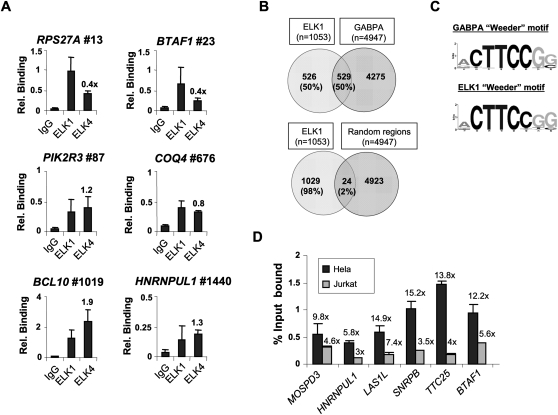
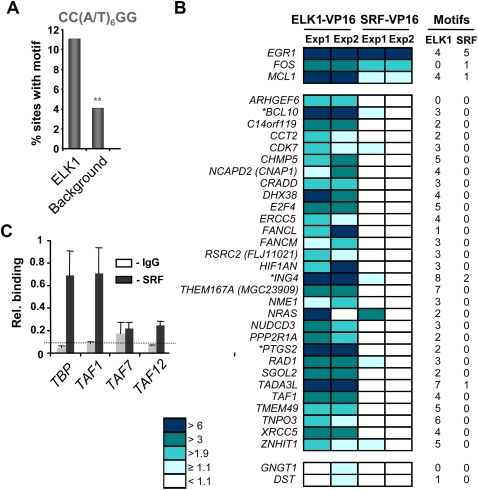
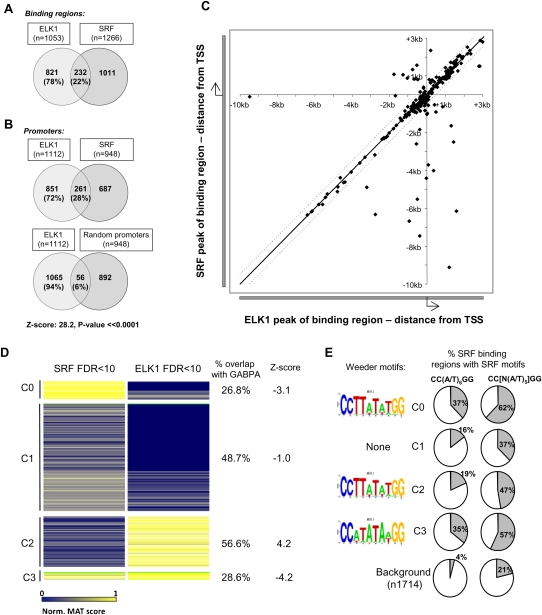
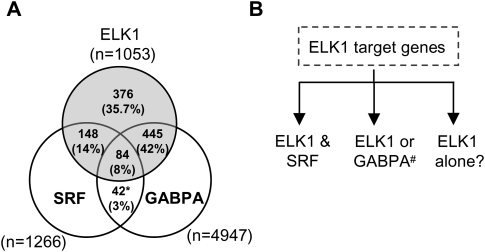
Transcription factors play an important role in orchestrating the activation of specific networks of genes through targeting their proximal promoter and distal enhancer regions. However, it is unclear how the specificity of downstream responses is maintained by individual members of transcription-factor families and, in most cases, what their target repertoire is. We have used ChIP-chip analysis to identify the target genes of the ETS-domain transcription factor ELK1. Two distinct modes of ELK1 target gene selection are identified; the first involves redundant promoter binding with other ETS-domain family members; the second occurs through combinatorial binding with a second transcription factor SRF, which specifies a unique group of target genes. One of the most prominent groups of genes forming the ELK1 target network includes classes involved in core gene expression control, namely, components of the basal transcriptional machinery, the spliceosome and the ribosome. Amongst the set of genes encoding the basal transcription machinery components, are a functionally linked subset of GTFs and TAFs. Our study, therefore, reveals an unsuspected level of coordinate regulation of components of the core gene expression control machinery and also identifies two different modes of promoter targeting through binding with a second transcription factor or redundant binding with other ETS-domain family members.


Figures

Figure 1.
Figure 1.
Validation of ELK1 targets identified by ChIP-chip. (A) MAT profiles of ELK1 binding to the novel BTAF1, ELF2, and PDLIM5 promoters, the known target MCL1, and the nontargeted promoter GNGT1. (B) qPCR-ChIP validation of ELK1 binding to the same set of promoters. Fold enrichment over IgG control precipitations is shown above each graph. Data are the average of duplicate samples and representative of three independent experiments.
Figure 2.
Figure 2.
Features of the ELK1-binding regions. (A) Sequence logo representation of the top 10-bp sequence identified by de novo searching the ELK1 FDR < 10 data set for over-represented motifs. The sequence of the optimum in vitro-selected ELK1-binding site (Shore and Sharrocks 1995) is shown and the inverted core GGAA “ETS binding motif” is boxed. (B) Over-representation of the optimal 10-bp ELK1-binding motif in the ELK1 FDR < 10 data set in comparison to a background data set. **P ≤ 1 × 10⁻⁴. (C) Location of the most significant probe of the ELK1-binding regions with respect to the closest transcriptional start site (TSS). The distances corresponding to each of the regions were grouped into bin sizes of 100 bp for quantification. (D) The number of nonredundant occurrences of the hexameric motifs CCGGAA, CGGAAG, and GGAAGT in each binding region in the ELK1 FDR < 10 (black lines) and background datasets (gray lines) was determined, and the distribution of the frequency of occurrence of numbers of motifs in each data set plotted.
Figure 3.
Figure 3.
Coordinate regulation of a subset of general transcription factors by ELK1. (A) Pie charts illustrating the frequency of occurrence of ELK1-binding events (light-shaded segment) in the total number of genes (represented by annotated gene symbols) on the promoter array (total), or in pathways identified by KEGG (“basal transcription factors” and “ribosome”) or BioCarta (“spliceosomal assembly”) pathway analysis. (B) Subunits of the basal transcription machinery are shaded, with shading representing subunits whose promoters are bound (light) or not bound (dark) by ELK1. (C) qPCR-ChIP verification of ELK1 binding to promoters of the indicated genes. The dotted line represents average binding across all IgG control precipitations. Data are representative of two independent experiments and the average of triplicate samples. (E) RT-PCR analysis of expression of the indicated genes following treatment with anisomycin for 60 min in HeLa cells in the presence and absence of control (GAPDH) (gray bars) or ELK1-specific (black bars) siRNA duplexes. A Western blot showing the expression of ELK1 and the levels of active JNK (P-JNK1/2) in each sample is shown in D. Error bars represent standard deviations calculated from three biologically independent replicates and the average of two samples. Asterisks denote differences with statistical significances (*P < 0.05; **P < 0.01) relative to the control sample for each gene (siGAPDH), as determined by the Students t-test.
Figure 4.
Figure 4.
Redundant promoter occupancy by ELK1 and other ETS-domain transcription factors. (A) qPCR-ChIP analysis of ELK1 and ELK4 binding to ELK1 target regions. The position of the binding region on the ranked target list is shown next to the gene name. Data are the average of duplicate samples and representative of three independent experiments. Relative binding ratios of ELK4 versus ELK1 are shown above the bars corresponding to ELK4. (B) Overlap in binding regions between ELK1 (FDR < 10) and GABPA ChIP-seq (Valouev et al. 2008) datasets. Comparisons were made with GABPA-binding regions that overlap with the tiled regions on the Affymetrix promoter arrays. The overlap between ELK1-binding regions and random equivalently sized promoter datasets is given for comparison. The total number of genes in each sector is shown, with percentages provided relative to the total number of ELK1 targets. (C) Sequence logo representation of the top 8-bp sequence identified by de novo searching the top 1000 binding regions identified as GABPA targets by ChIP-seq (±100 bp of midpoint) or the ELK1 FDR < 10 ChIP-chip datasets by Weeder. (D) qPCR-ChIP analysis of ELK1 binding to a set of promoters identified as binding to both ELK1 and GABPA. Data are presented as percent input bound in either HeLa (black bars) or Jurkat (gray bars) cells. Fold enrichment over IgG control precipitations is shown above each graph. Data are the average of duplicate samples from three independent experiments.
Figure 5.
Figure 5.
SRF-dependent and independent ELK1 target promoters. (A) Over-representation of the CC(W)6GG SRF-binding motif in the ELK1 FDR < 10 data set in comparison to a background data set. **P ≤ 1 × 10⁻⁴. (B) Reporter gene analysis in 293 cells of a panel of promoters containing ELK1-binding regions. Cells were cotransfected with the indicated reporter plasmids and plasmids encoding either ELK1–VP16 or SRF–VP16. Data are shown from two independent experiments (Exp1/2) and the levels of reporter activity are color coded according to fold activation by ELK1–VP16 or SRF–VP16. The numbers of ELK1 (nonredundant hexamers derived from CCGGAAGT motif) and SRF (CC(W)6GG) binding motifs in each promoter is shown on the right, and genes also found in the high confidence SRF ChIP-chip FDR < 1 data set are indicated by asterisks. (C) qPCR-ChIP analysis of SRF binding to the indicated promoters. The dotted line represents average binding across all IgG control precipitations. Data are the average of duplicate samples and representative of three independent experiments.
Figure 6.
Figure 6.
Co-occupancy of promoters by SRF and ELK1 is a common event. (A,B) Overlap between binding events from the ELK1 FDR < 10 and SRF FDR < 10 datasets, when either binding regions (A) or co-occupancy of promoter regions (B) are considered. The overlap between ELK1-binding regions and random equivalently sized promoter datasets is given for comparison in B. The total number of genes in each sector is shown, with percentages also provided relative to the total number of ELK1 targets. (C) Scatter plot of the location of the peak binding positions of ELK1 FDR < 10 and SRF FDR < 10 binding regions relative to their closest and shared gene promoter TSS. The black and dotted lines indicate a distance of 0 and 500 nucleotides between the most significant probes in the ELK1- and SRF-binding region, respectively. (D) Cluster analysis of the ELK1 FDR < 10 and SRF FDR < 10 datasets (set to produce four clusters, C0–C3). The color variations between blue and yellow identify nonbound to strong binding events, respectively (as defined by normalized MAT scores). The percentage overlap of ELK1-binding regions in the four clusters that overlap with all GABPA ChIP-seq regions is shown on the right. The associated Z-score is based upon the chance of observing the same overlap using 1000 random sets of the ELK1 FDR < 10 binding regions compared with the observed overlap between the ELK1-binding regions in the cluster that overlap GABPA-binding regions. Clusters 0–3 contain 208, 1220, 577, and 86 binding regions, respectively. (E) SRF-like motifs identified in each of the four clusters (C0–C3) by Weeder analysis are shown on the left. The percentage occurrence of the CC(W)6GG and more degenerate CC[N(W)5]GG SRF binding motifs in each of the clusters (C0–C3) in comparison to a background data set is shown on the right.
Figure 7.
Figure 7.
Overlaps between promoter binding regions for ELK1, SRF, and GABPA. (A) Venn diagrams showing the overlap in target region binding between ELK1 FDR < 10, SRF FDR < 10, and GABPA ChIP-seq (Valouev et al. 2008) datasets. Comparisons were made with GABPA binding regions that overlap with the tiled regions on the Affymetrix promoter arrays. The total number of binding regions in each sector is shown, with percentages also provided relative to the total number of ELK1 targets. (B) Summary of the three classes of ELK1 target genes identified in this study, which are bound by (1) ELK1 and SRF, (2) ELK1 or GABPA, or (3) ELK1 alone. The # symbol indicates that redundancy with other ETS-domain proteins is likely.

References

    1. Albright SR, Tjian R. TAFs revisited: More data reveal new twists and confirm old ideas. Gene. 2000;242:1–13. - PubMed
    1. Bohlander SK, Espinosa R, III, Le Beau MM, Rowley JD, Díaz MO. A method for the rapid sequence-independent amplification of microdissected chromosomal material. Genomics. 1992;13:1322–1324. - PubMed
    1. Carroll JS, Liu XS, Brodsky AS, Li W, Meyer CA, Szary AJ, Eeckhoute J, Shao W, Hestermann EV, Geistlinger TR, et al. Chromosome-wide mapping of estrogen receptor binding reveals long-range regulation requiring the forkhead protein FoxA1. Cell. 2005;122:33–43. - PubMed
    1. Dalton S, Treisman R. Characterization of SAP-1, a protein recruited by serum response factor to the c-fos serum response element. Cell. 1992;68:597–612. - PubMed
    1. Deato MD, Tjian R. Switching of the core transcription machinery during myogenesis. Genes & Dev. 2007;21:2137–2149. - PMC - PubMed

Publication types

MeSH terms