. 2009 Aug 31;206(9):1971-82.
doi: 10.1084/jem.20082392. Epub 2009 Aug 17.

Augmented TLR9-induced Btk activation in PIR-B-deficient B-1 cells provokes excessive autoantibody production and autoimmunity

Affiliations

Augmented TLR9-induced Btk activation in PIR-B-deficient B-1 cells provokes excessive autoantibody production and autoimmunity

Tomohiro Kubo et al. J Exp Med. .

Abstract

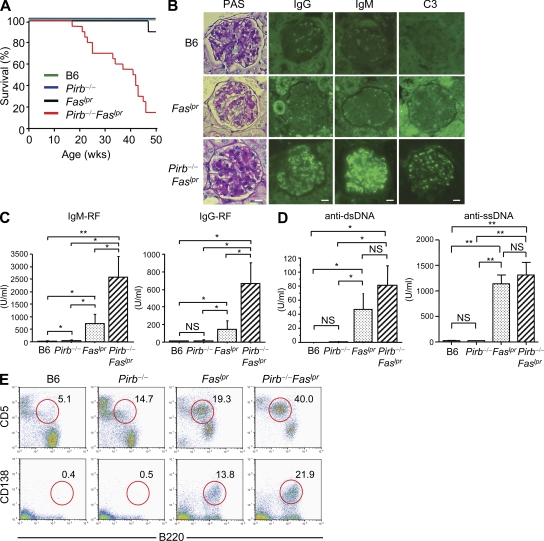
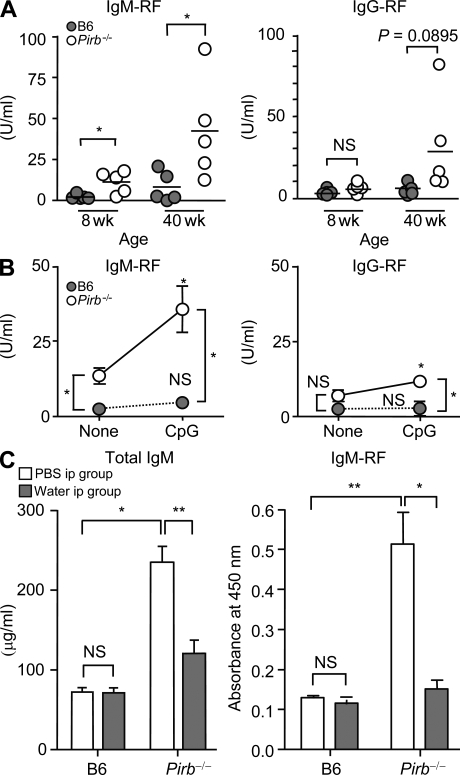
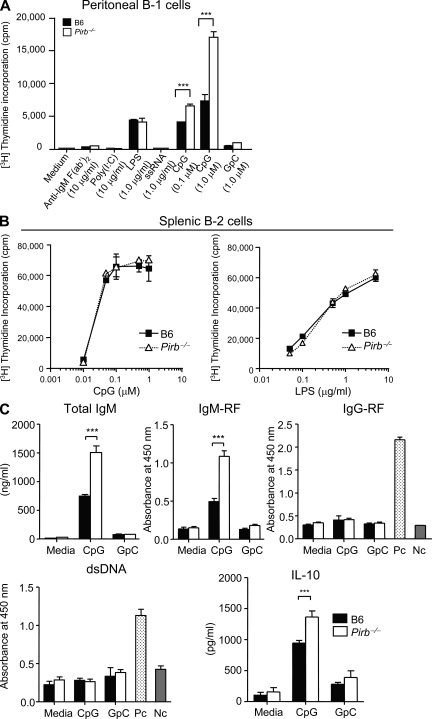
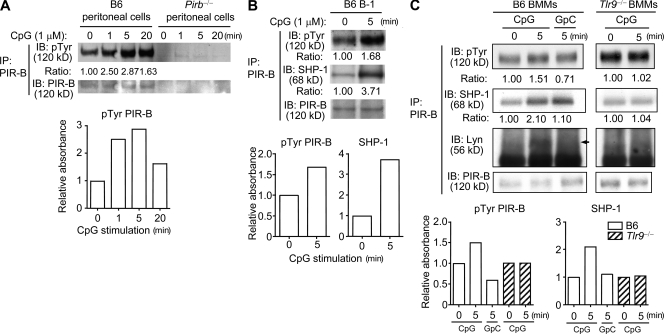
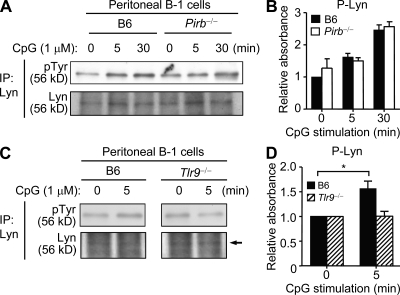
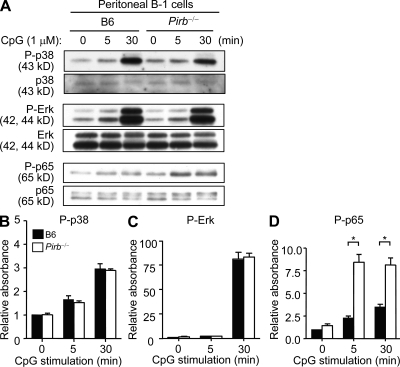
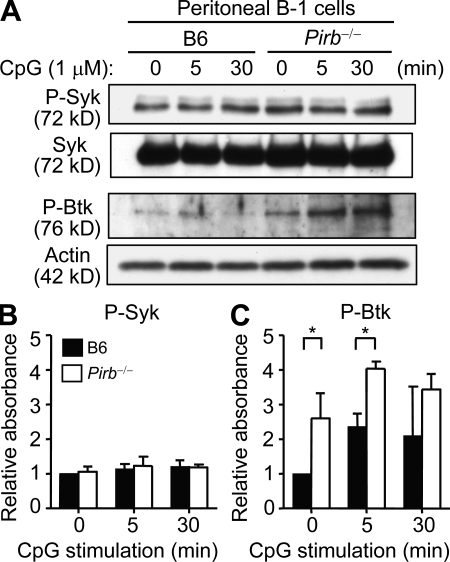
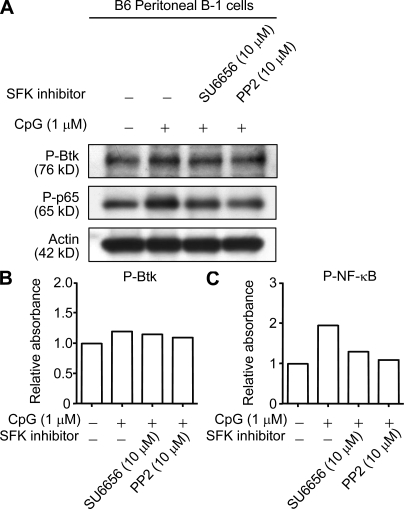
Pathogens are sensed by Toll-like receptors (TLRs) expressed in leukocytes in the innate immune system. However, excess stimulation of TLR pathways is supposed to be connected with provocation of autoimmunity. We show that paired immunoglobulin (Ig)-like receptor B (PIR-B), an immunoreceptor tyrosine-based inhibitory motif-harboring receptor for major histocompatibility class I molecules, on relatively primitive B cells, B-1 cells, suppresses TLR9 signaling via Bruton's tyrosine kinase (Btk) dephosphorylation, which leads to attenuated activation of nuclear factor kappaB p65RelA but not p38 or Erk, and blocks the production of natural IgM antibodies, including anti-IgG Fc autoantibodies, particularly rheumatoid factor. The autoantibody production in PIR-B-deficient (Pirb(-/-)) mice was further augmented in combination with the Fas(lpr) mutation, which might be linked to the development of autoimmune glomerulonephritis. These results show the critical link between TLR9-mediated sensing and a simultaneously evoked, PIR-B-mediated inhibitory circuit with a Btk intersection in B-1 cells, and suggest a novel way toward preventing pathogenic natural autoantibody production.


Figures

Figure 1.
Figure 1.
Pirb−/− with the Faslpr mutation is sufficient in mice for the development of glomerulonephritis with marked elevation of RF production. (A) Pirb−/−Faslpr mice were remarkably short-lived. The survival curves for male and female B6.Pirb−/−Faslpr (n = 20 mice per group), B6.Faslpr (n = 20), B6.Pirb−/− (n = 20), and B6 (n = 20) mice until 50 wk of age are shown. (B) Pirb−/−Faslpr mice develop diffuse glomerulonephritis with a mild increase in the size and cellularity of the glomerulus, and depositions of IgG, IgM, and complement C3. Kidney sections from each strain of mice at 24 wk of age were stained with PAS or Alexa Fluor 488 anti–mouse IgG, IgM, and C3. Each panel is representative of samples from five mice per group with similar staining profiles in a single staining experiment. Bars, 10 µm. (C) Both the IgM- and IgG-RF levels were significantly more elevated in Pirb−/−Faslpr mice than those in Faslpr mice. RF in sera from each strain of mice at 24 wk of age was measured by ELISA. Data are shown as means ± SEM (n = 8 mice per group) and are representative of three separate experiments with similar results. Statistical analyses were performed using a Student's t test. *, P < 0.05; **, P < 0.01. (D) The anti-dsDNA and anti-ssDNA autoantibody levels were augmented but not significantly elevated in the Pirb−/−Faslpr mice tested compared with Faslpr mice. Anti-DNA in sera from each strain of mice at 24 wk of age for anti-dsDNA or at 4–10 mo of age for anti-ssDNA was measured by ELISA. Data are shown as means ± SEM (n = 8 mice per group) and are representative of three (anti-dsDNA) or two (anti-ssDNA) separate experiments with similar results. Statistical analyses were performed using a Student's t test. *, P < 0.05; **, P < 0.01. (E) Markedly enlarged peritoneal B-1 cell and splenic plasma cell populations in Pirb−/−Faslpr mice. Peritoneal cells isolated from 24-wk-old mice were stained with anti-B220, CD5, and CD3. B220+CD5+CD3 B-1 cells (circled) with the percentages are shown (top). Staining of peritoneal cells from Pirb−/− mice with anti-CD19, instead of B220, gave a B-1 cell population with a similar size (not depicted in the figure). Splenocytes isolated from 24-wk-old mice were stained with anti-CD138, B220, IgM, and IgD. CD138+B220+IgMIgD plasma cells (circled) with the percentages are shown (bottom). The figure is representative of five mice per group.
Figure 2.
Figure 2.
Enhanced RF production in Pirb−/− mice. (A) The IgM-RF levels are significantly elevated in Pirb−/−, aged mice in particular. Sera from wild-type B6 and Pirb−/− mice at 8 and 40 wk of age were subjected to measurement of the IgM- and IgG-RF levels by ELISA. Data are shown as means ± SEM (n = 5 mice per group) and are representative of three separate experiments with similar results. Statistical analyses were performed using a Student's t test. *, P < 0.05. (B) Both the IgM- and IgG-RF levels in sera were elevated in Pirb−/− mice after CpG-B administration into the peritoneum of the animals. B6 and Pirb−/− mice at 8 wk of age were injected with 3 nmol CpG-B into the peritoneal cavity. Serum samples collected after 48 and 120 h were analyzed by ELISA for IgM- and IgG-RF, respectively. Data are shown as means ± SEM (n = 4 mice per group) and are representative of three separate experiments with similar results. Statistical analyses were performed using a Student's t test. *, P < 0.05. (C) IgM-RF is produced preferentially by peritoneal B cells. B6 and Pirb−/− mice at 5 wk of age were injected intraperitoneally with water or PBS as a negative control to achieve relatively specific elimination of the B-1 cells (Murakami et al., 1995). After four rounds of water injection, the total IgM level was significantly decreased and the IgM-RF was substantially lost in sera from Pirb−/− mice. Data are shown as means ± SEM (n = 3 mice per group) and are representative of three separate experiments with similar results. Statistical analyses were performed using a Student's t test. *, P < 0.05.
Figure 3.
Figure 3.
Enhanced responses in peritoneal B-1 cells from Pirb−/− mice upon CpG-B stimulation in vitro. (A and B) Proliferation of peritoneal B-1 cells (A) or splenic B-2 cells (B) from wild-type B6 and Pirb−/− mice (n = 5 per group) with various stimuli. Peritoneal B-1 cells and splenic B-2 cells were pulse labeled with [3H]thymidine during the last 8 h of the 48-h culture period with or without a stimulant. Data are shown as means ± SEM of triplicate cultures and are representative of three independent experiments. Statistical analyses were performed using two-way analysis of variance. ***, P < 0.001. (C) Production of Igs, autoantibodies, and a cytokine by peritoneal B-1 cells from B6 and Pirb−/− mice (n = 5 per group). B-1 cells were stimulated with 1 µM CpG-B or GpC control, and assessed for total IgM, IgM-RF, IgG-RF, anti-dsDNA, and IL-10 by ELISA. Data are shown as means ± SEM of triplicate cultures, and are representative of three independent experiments. Statistical analyses were performed using a Student's t test. ***, P < 0.001. Provided standard and assay diluent supplemented in the ELISA kit were served as positive control (Pc) and negative control (Nc), respectively.
Figure 4.
Figure 4.
Augmented phosphorylation of PIR-B and enhanced recruitment of SHP-1 in peritoneal B-1 cells stimulated with CpG-B. (A) Time course of tyrosine phosphorylation of PIR-B in peritoneal cells from B6 and Pirb−/− mice (n = 8 per group) stimulated with CpG-B. After stimulation with 1 µM CpG-B, samples were taken at various time points and first immunoprecipitated (IP) with anti–PIR-B and then immunoblotted (IB) to visualize PIR-B phosphotyrosine (top), followed by reprobing with anti–PIR-B (bottom). Data are representative of three separate experiments with similar results. (B) Augmented tyrosine phosphorylation of PIR-B and enhanced recruitment of SHP-1 in peritoneal B-1 cells stimulated with CpG-B. B-1 cells from wild-type B6 mice (n = 12) were stimulated with 1 µM CpG-B and subjected to immunoprecipitation and protein blot analysis (IP-Western) to visualize the phosphotyrosylation of PIR-B (top), SHP-1 (middle), and PIR-B (bottom). Data are representative of three separate experiments with similar results. (C) Phosphotyrosylation of PIR-B upon CpG stimulation is dependent on TLR9. Bone marrow–derived cultured macrophages (BMMs) from wild-type B6 mice (left) and TLR9-deficient (Tlr9−/−) mice (right; n = 4 per group) were stimulated with 1 µM CpG-B or GpC control DNA, and subjected to IP-Western to visualize phosphotyrosylated PIR-B (top), SHP-1 (second from top), Lyn (second from bottom; arrow), and PIR-B (bottom). Data are representative of three separate experiments with similar results. The intensity for each band was estimated by densitometric scanning with normalization as to loading control.
Figure 5.
Figure 5.
Up-regulated phosphorylation of Lyn upon CpG-B stimulation of wild-type and Pirb−/− B-1 cells but not Tlr9−/− cells. (A and B) Peritoneal B-1 cells from wild-type B6 and Pirb−/− mice (n = 12 per group) were stimulated with 1 µM CpG-B and subjected to IP-Western analysis to visualize the phosphprylated Lyn (A). The phosphorylation levels of Lyn were estimated by densitometric scanning with normalization as to loading control and are depicted as a bar graph (B). Lyn phosphorylation was augmented upon CpG stimulation regardless of the presence or absence of PIR-B. Data are shown as means ± SEM of three separate experiments. (C and D) Peritoneal B-1 cells from wild-type B6 and Tlr9−/− mice (n = 12 per group) were stimulated with 1 µM CpG-B and subjected to IP-Western analysis to visualize the phosphorylated Lyn (C). The phosphorylation levels of Lyn were estimated by densitometric scanning with normalization as to loading control and are depicted as a bar graph (D). Augmented Lyn phosphorylation was not observed in Tlr9−/− B-1 cells. Data are shown as means ± SEM of three separate experiments. Control bands of Lyn (∼56 kD) were obscured by 40–60-kD diffuse bands originated from protein A released from immunoprecipitation beads. *, P < 0.05.
Figure 6.
Figure 6.
p38 and Erk phosphorylation is not grossly influenced by PIR-B, whereas NF-κB p65RelA phosphorylation is markedly augmented in Pirb−/− B-1 cells. (A–D) Immunoblot analysis of phospho-p38, phospho-Erk, and phospho-p65RelA after CpG stimulation of peritoneal B-1 cells from wild-type B6 and Pirb−/− mice (n = 10–14 per group). Although the time courses and augmentation magnitudes of the phosphorylation of p38 and Erk were not grossly different between wild-type and Pirb−/− B-1 cells (A–C), phosphorylation of NF-κB p65RelA was markedly augmented in Pirb−/− B-1 cells (A and D). The intensity for each band was estimated by densitometric scanning with normalization as to loading control. Data are shown as means ± SEM of three separate experiments. *, P < 0.05.
Figure 7.
Figure 7.
Phosphorylation of Btk but not Syk is markedly up-regulated upon CpG-B stimulation of Pirb−/− B-1 cells. (A–C) Peritoneal B-1 cells from B6 and Pirb−/− mice (n = 10–14 per group) were stimulated with 1 µM CpG-B and subjected to immunoblot analysis for visualization of phospho-Syk and phospho-Btk (A), which was estimated by densitometric scanning with normalization as to actin (B and C). Data are shown as means ± SEM of three separate experiments. *, P < 0.05.
Figure 8.
Figure 8.
CpG-B–induced phosphorylation of Btk and NF-κB p65RelA in peritoneal B-1 cells is down-regulated by Src family kinase inhibitors. (A–C) Peritoneal B-1 cells from wild-type B6 mice (n = 12) were treated with 10 µM SU6656 or PP2 for 30 min before stimulation with 1 µM CpG-B. 5 min later, cell lysates were subjected to immunoblot analysis to visualize the phosphorylation of Btk (top), NF-κB p65RelA (middle), and loading control β-actin (bottom; A). The phosphorylation levels of Btk and p65RelA were estimated by densitometric scanning with normalization as to actin and are depicted as bar graphs (B and C). Data are representative of three separate experiments with similar results.

References

    1. Akira S., Takeda K., Kaisho T. 2001. Toll-like receptors: critical proteins linking innate and acquired immunity.Nat. Immunol. 2:675–680 - PubMed
    1. An H., Hou J., Zhou J., Zhao W., Xu H., Zheng Y., Yu Y., Liu S., Cao X. 2008. Phosphatase SHP-1 promotes TLR- and RIG-I-activated production of type I interferon by inhibiting the kinase IRAK1.Nat. Immunol. 9:542–550 - PubMed
    1. Baccala R., Hoebe K., Kono D.H., Beutler B., Theofilopoulos A.N. 2007. TLR-dependent and TLR-independent pathways of type I interferon induction in systemic autoimmunity.Nat. Med. 13:543–551 - PubMed
    1. Baumgarth N., Tung J.W., Herzenberg L.A. 2005. B-1 B cells: development, selection, natural autoantibody and leukemia.Springer Semin. Immunopathol. 26:347–362 - PubMed
    1. Berland R., Wortis H.H. 2002. Origins and functions of B-1 cells with notes on the role of CD5.Annu. Rev. Immunol. 20:253–300 - PubMed

Publication types

MeSH terms