. 2009 Sep 7;54(17):5341-57.
doi: 10.1088/0031-9155/54/17/017. Epub 2009 Aug 18.

A comprehensive system for dosimetric commissioning and Monte Carlo validation for the small animal radiation research platform

Affiliations

A comprehensive system for dosimetric commissioning and Monte Carlo validation for the small animal radiation research platform

E Tryggestad et al. Phys Med Biol. .

Abstract

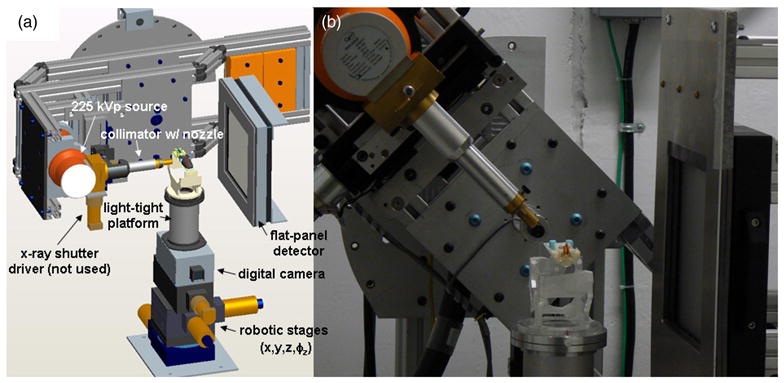
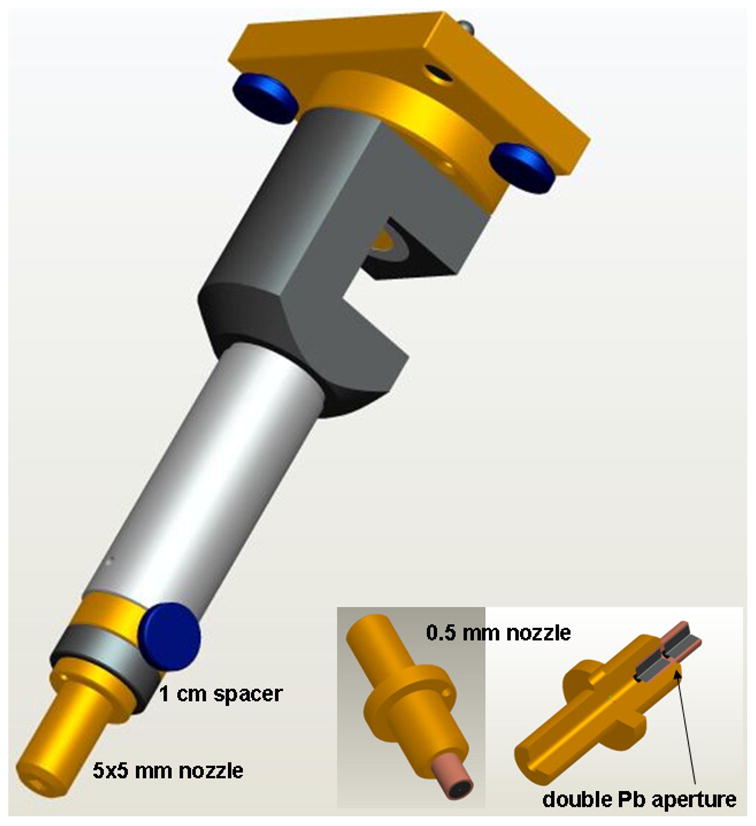
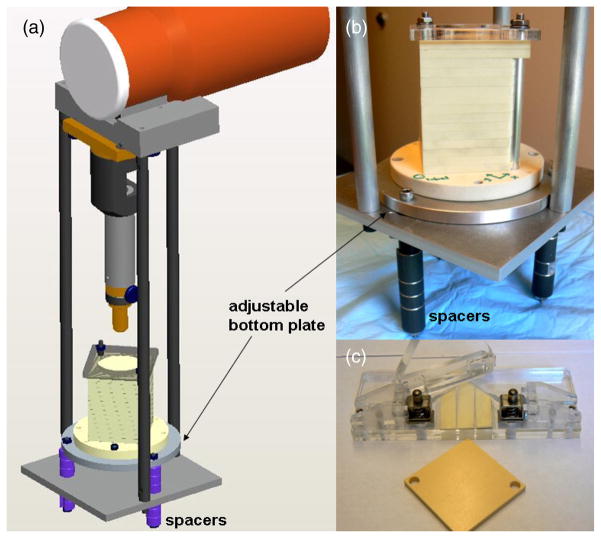
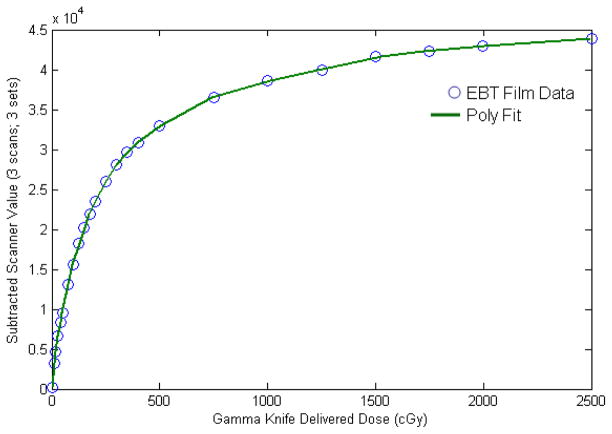
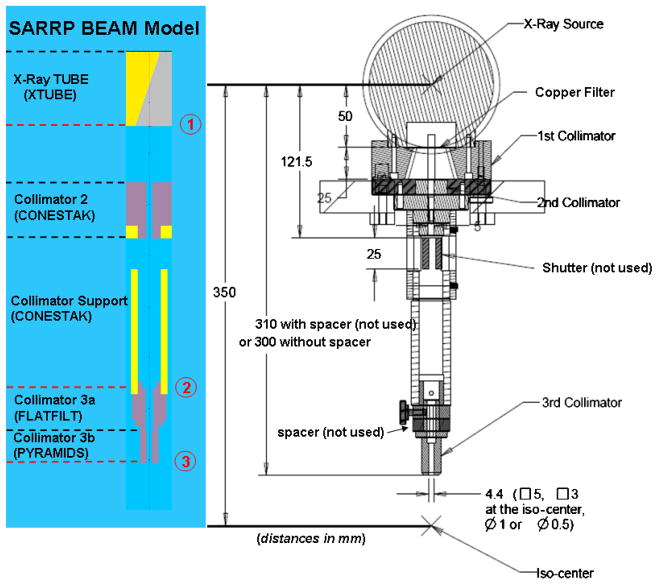
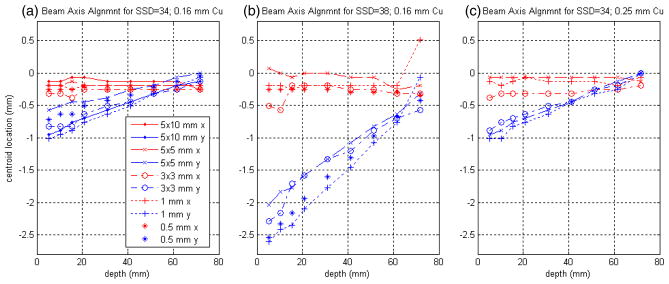
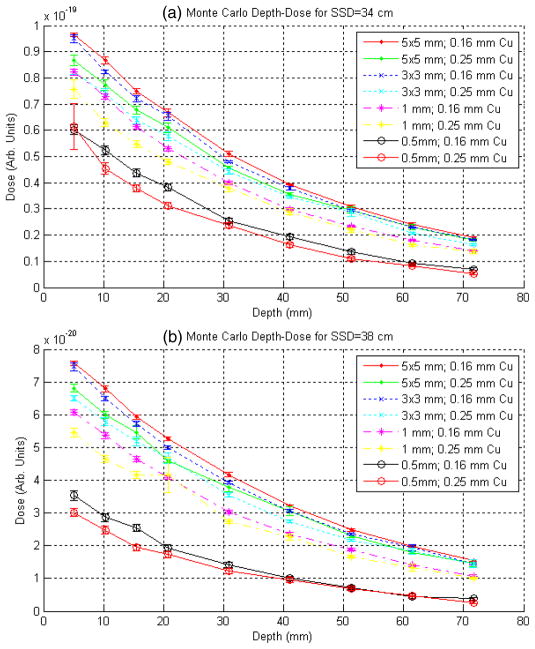
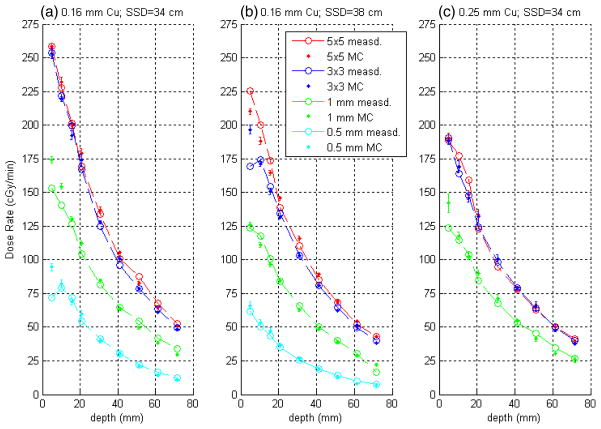
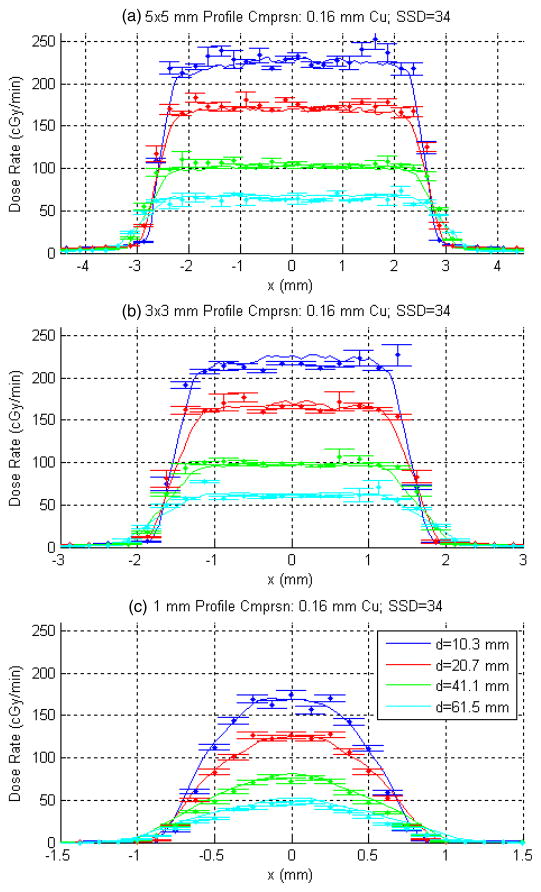
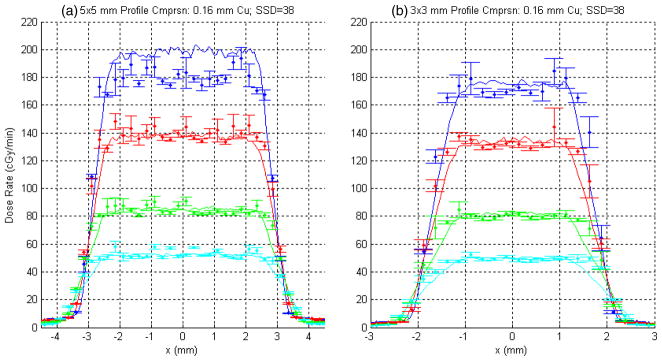
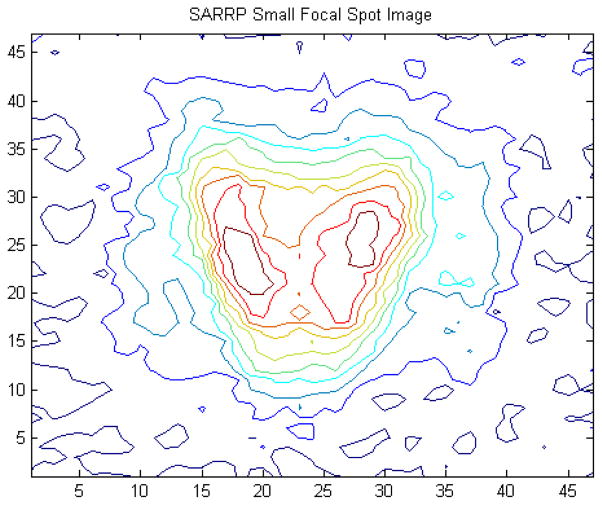
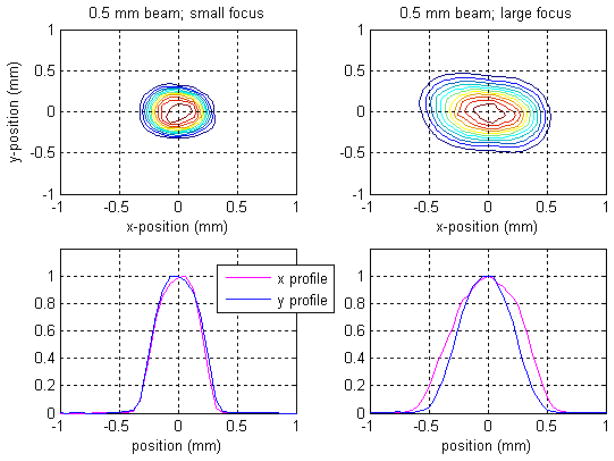
Our group has constructed the small animal radiation research platform (SARRP) for delivering focal, kilo-voltage radiation to targets in small animals under robotic control using cone-beam CT guidance. The present work was undertaken to support the SARRP's treatment planning capabilities. We have devised a comprehensive system for characterizing the radiation dosimetry in water for the SARRP and have developed a Monte Carlo dose engine with the intent of reproducing these measured results. We find that the SARRP provides sufficient therapeutic dose rates ranging from 102 to 228 cGy min(-1) at 1 cm depth for the available set of high-precision beams ranging from 0.5 to 5 mm in size. In terms of depth-dose, the mean of the absolute percentage differences between the Monte Carlo calculations and measurement is 3.4% over the full range of sampled depths spanning 0.5-7.2 cm for the 3 and 5 mm beams. The measured and computed profiles for these beams agree well overall; of note, good agreement is observed in the profile tails. Especially for the smallest 0.5 and 1 mm beams, including a more realistic description of the effective x-ray source into the Monte Carlo model may be important.


Figures

Figure 1
Figure 1
(a) Design rendering and (b) photo of the latest working version of the SARRP. The system comprises a constant-voltage, dual-focus, 225 kVp source mounted on a rotating arm, a collimation system with interchangeable nozzles, a set of robotic stages for positioning the animal, an amorphous Si flat panel detector and a digital fluoroscopic camera box.
Figure 2
Figure 2
Design rendering of the high-precision beam collimation system for the SARRP. The collimating components are made of brass. Aluminum is used elsewhere. The downstream edge of the last field-shaping ‘nozzle’ collimator is located at 30 cm from the presumed source of the x-ray tube (but can be extended to 31 cm with the indicated spacer). Interchangeable nozzles provide different rectangular or circular radiation fields. A special design incorporating lead for the final aperture was used for the smallest 0.5 mm collimator, shown in the lower-right insert.
Figure 3
Figure 3
The commissioning jig, 6 × 6 × 8 cm cubed plastic water phantom assembly and related equipment. Using this system, EBT films are sandwiched between layers of 5 mm thick, kV-equivalent plastic water and are rigidly indexed to the beam axis. A custom film hole puncher (c) was constructed for this purpose. Note that the indicated bottom plate of the jig can slide along the vertical beam axis, its position being determined by the configuration of the spacers (a and b). This allows that the source-to-surface distance (SSD) be varied.
Figure 4
Figure 4
The result of the EBT film calibration process. 69 films were irradiated with doses (or exposure times) spanning from 0 to 25 Gy using a Gamma Knife (60Co) irradiator. Data points: the difference in scan-averaged transmission values, before and after radiation exposure, was correlated to the known radiation dose, averaging over three films which had been exposed simultaneously. Line: A 12th-order polynomial fit described the data well, except in the extreme low-dose region (0–11 cGy), where a linear fit was smoothly matched.
Figure 5
Figure 5
Right: the SARRP x-ray source and collimator design rendered in the A–B–z plane for the 5 × 5 nozzle. Note that collimator 3 is interchangeable, depending on the desired field size. Left: corresponding SARRP BEAM Monte Carlo model in the G-T–z plane, indicating the types and locations of the incorporated component modules (CMs). The CMs labeled Collimator 3a and 3b differed depending on the field size simulated. A large phase-space file generated at the labeled z-location 1, at the exit of the x-ray tube, was used as input for the second-stage simulations, which incorporated the different choice of Cu filtration. These secondary phase-space files, sampled at z-location 2, were then used as input in the tertiary or final simulations which computed phase-space files at z-location 3; in the final simulations, Collimators 3a and 3b were varied.
Figure 6
Figure 6
Correspondence of the SARRP commissioning jig z-axis with the physical beam axis, as indicated by the location of the measured beam spot on the registered films as a function of depth. Red and blue data points correspond to the observed beam-spot centroids in x and y, respectively. The film set exposures for (a) and (c) were measured one after the other, whereas (b), for SSD = 38 cm, was measured last and required a change in the configuration of spacers to change the SSD. (See text for further description).
Figure 7
Figure 7
Raw depth–dose curves in water from the Monte Carlo calculations for the full set of simulated geometries using the CHAMBER CM description of the measurement phantom. Plotted in (a) and (b), respectively, are the results for SSD = 34 and 38 cm. All simulations were seeded with the same primary PSF at the exit of the x-ray tube, thus the relative relationship between the curves is meaningful. The statistical error bars included here were computed by BEAM. (See the text for further description.)
Figure 8
Figure 8
Comparison of measured and computed depth–dose curves for the SARRP. Plotted are (a) SSD = 34 with 0.16 mm Cu; (b) SSD = 38 with 0.16 mm Cu; (c) SSD = 34 with 0.25 mm Cu filtration. Measured data are plotted as open circles with Monte Carlo data plotted as points with statistical error bars computed by BEAM. Computed data have been normalized to measurement to best-fit over the range of depths.
Figure 9
Figure 9
A sampling of measured (solid lines) versus computed x-profiles (points) for SSD = 34 cm and 0.16 mm Cu filtration for (a) 5 × 5 mm2, (b) 3 × 3 mm2 and (c) 1 mm collimators. Four of nine measured depths, chosen arbitrarily, are shown. DOSXYZ was used to generate the computed profiles, with statistical error bars shown. For a given aperture size, the computed results were normalized to measurement in the high-dose regions, giving equal weights to all depths (including those not shown) and applying a single scaling factor.
Figure 10
Figure 10
Measured (solid lines) versus computed x-profiles (points) for SSD = 38 and 0.16 mm Cu filtration for (a) 5 × 5 mm2 and (b) 3 × 3 mm2. The same four depths from figure 9 are shown. Note that in this case the corresponding normalization factors derived from the profiles in figure 9 (SSD = 34 cm) were applied.
Figure 11
Figure 11
An image of the SARRP 0.4 mm (small) focal spot in the gun-target, A–B plane as rendered through a 100 μm pinhole punched in a 0.25 mm thick brass plate located 6 cm from the source and imaged at 35 cm from the source using EBT film.
Figure 12
Figure 12
Dependence of the SARRP 0.5 mm circular beam on the focal-spot size. The left panels show a 2D contour dose plot and individual x, y dose profiles for the smallest SARRP beam resulting from the small focal-spot size (0.4 mm). The beam is reasonably symmetric. The right panels are the corresponding results for the large focal spot (3 mm). The beam in this case is considerably broader and asymmetric, with a slight rotation evident in the 2D distribution.

References

    1. Berger MJ, Hubbell JH. Report NBSIR87-3597. Gaithersburg, MD: NIST; 1987. XCOM: photon cross sections on a personal computer.
    1. Devic S, Seuntjens J, Sham E, Podgorsak EB, Schmidtlein CR, Kirov AS, Soares CG. Precise radiochromic film dosimetry using a flat-bed document scanner. Med Phys. 2005;32:2245–53. - PubMed
    1. Graves EE, Zhou H, Chatterjee R, Keall PJ, Gambhir SS, Contag CH, Boyer AL. Design and evaluation of a variable aperture collimator for conformal radiotherapy of small animals using a microCT scanner. Med Phys. 2007;34:4359–67. - PubMed
    1. Jaffray D, Moseley D, Chow J, Kim S, Ansell S, Wilson G, Chiarot C. An image-guided irradiator for pre-clinical radiation therapy studies (abstract) Med Phys. 2006;33:2241.
    1. Matinfar M, Ford E, Iordachita I, Wong J, Kazanzides P. Image guided small animal radiation research platform: calibration of treatment beam alignment. Phys Med Biol. 2009;54:891–905. - PMC - PubMed

Publication types