. 2009 Aug;7(8):e1000172.
doi: 10.1371/journal.pbio.1000172. Epub 2009 Aug 18.

Persistent cAMP-signals triggered by internalized G-protein-coupled receptors

Affiliations

Persistent cAMP-signals triggered by internalized G-protein-coupled receptors

Davide Calebiro et al. PLoS Biol. 2009 Aug.

Abstract

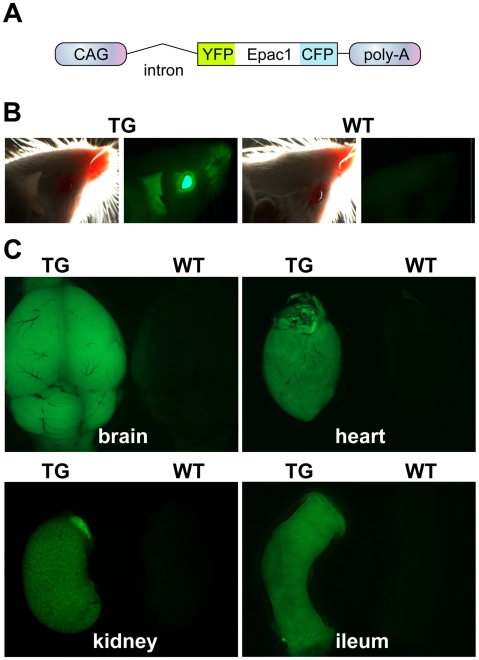
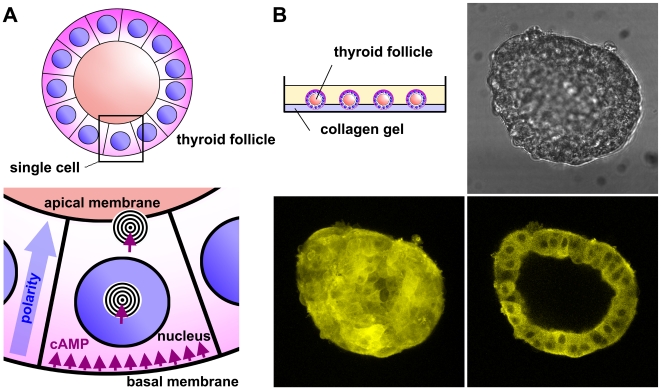
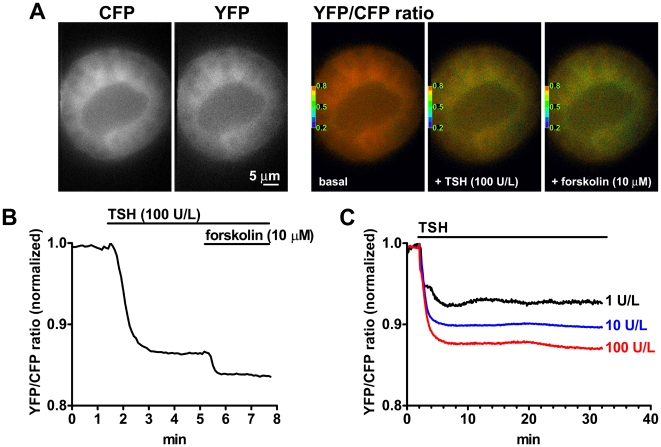
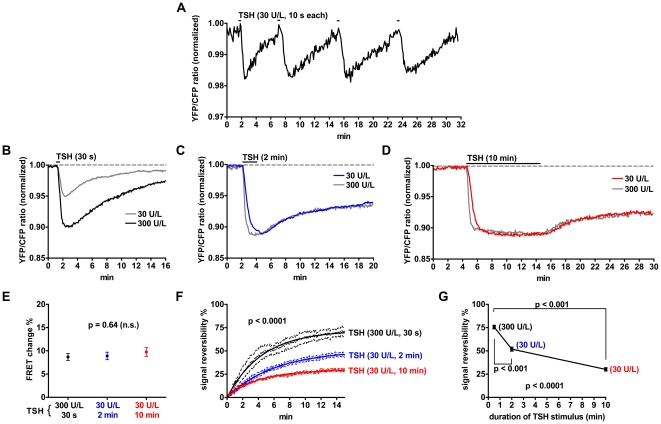
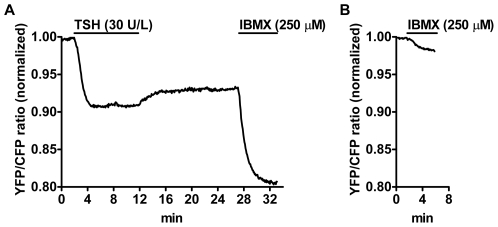
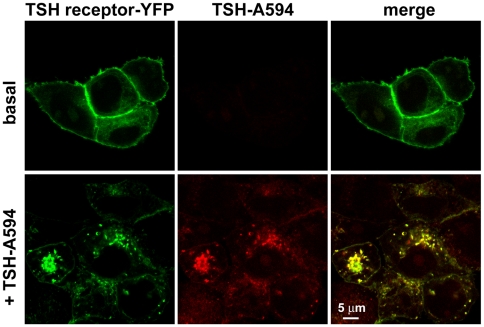
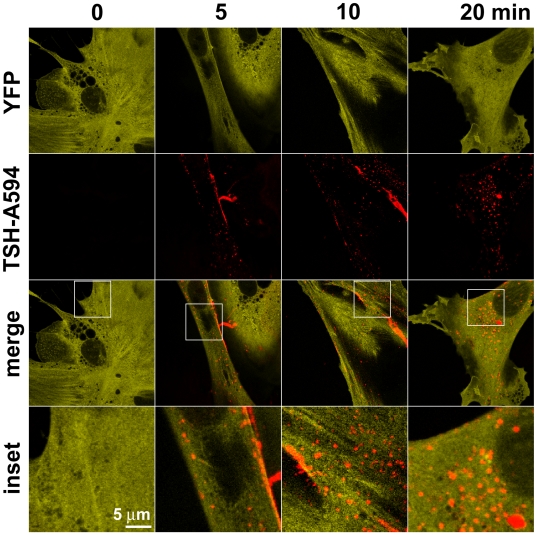
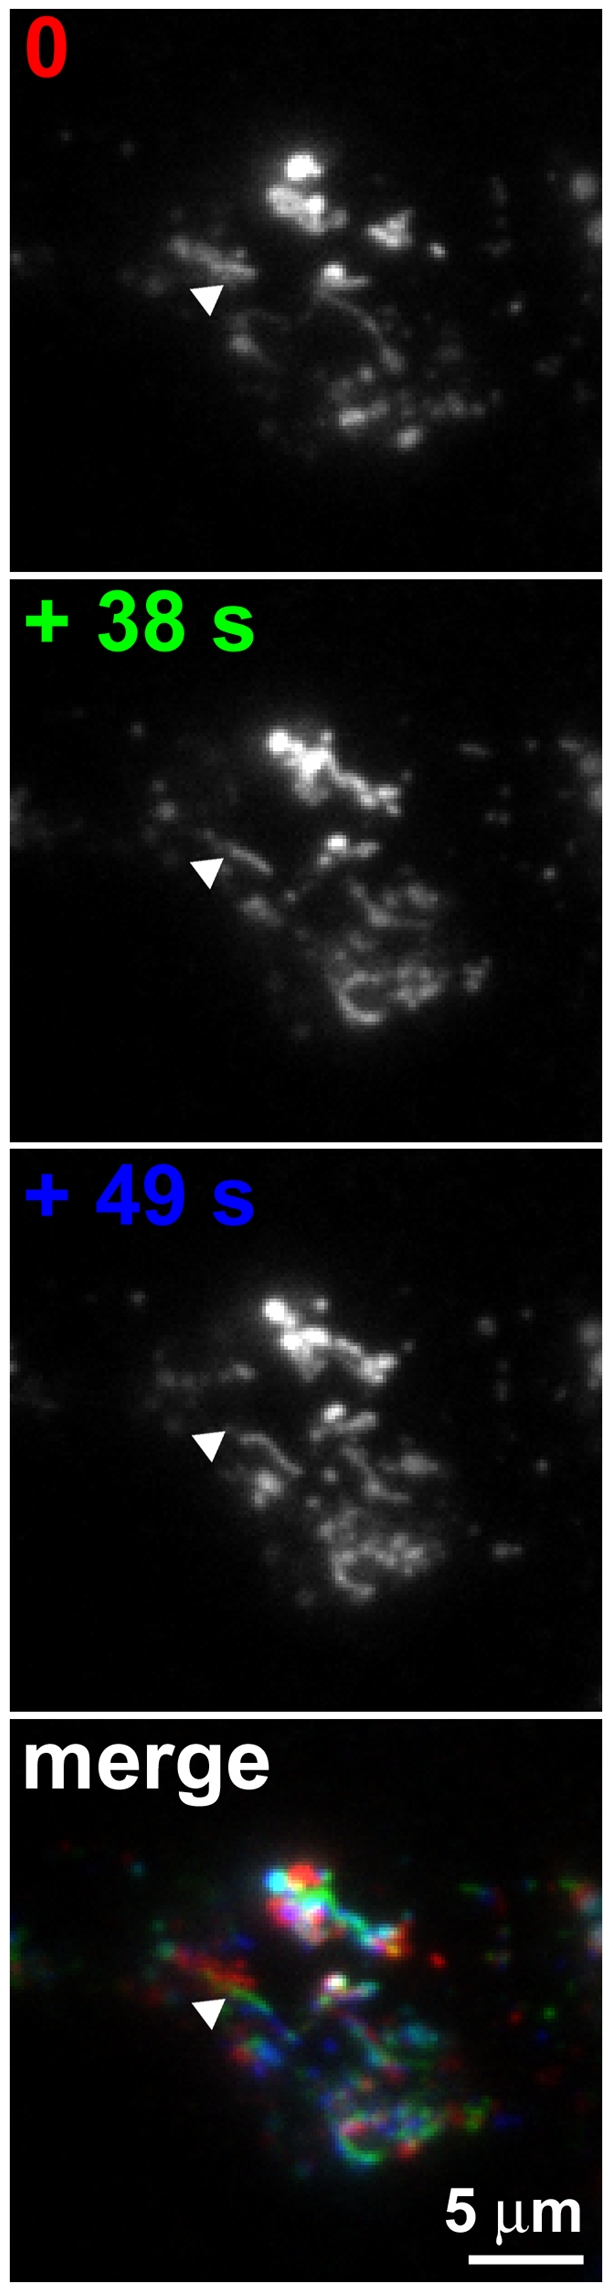
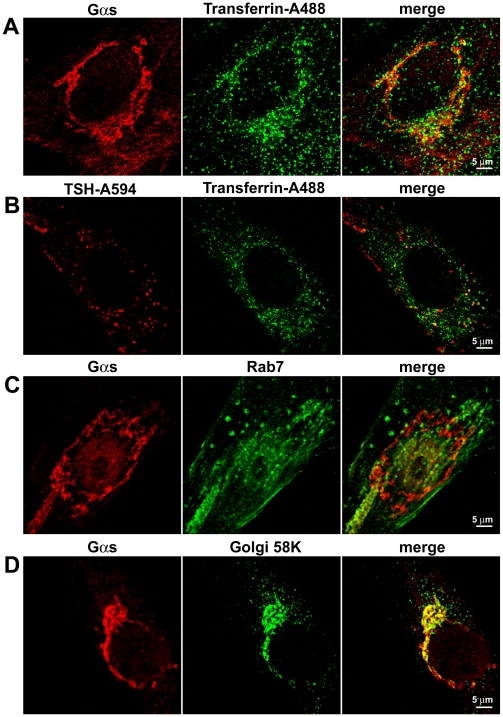
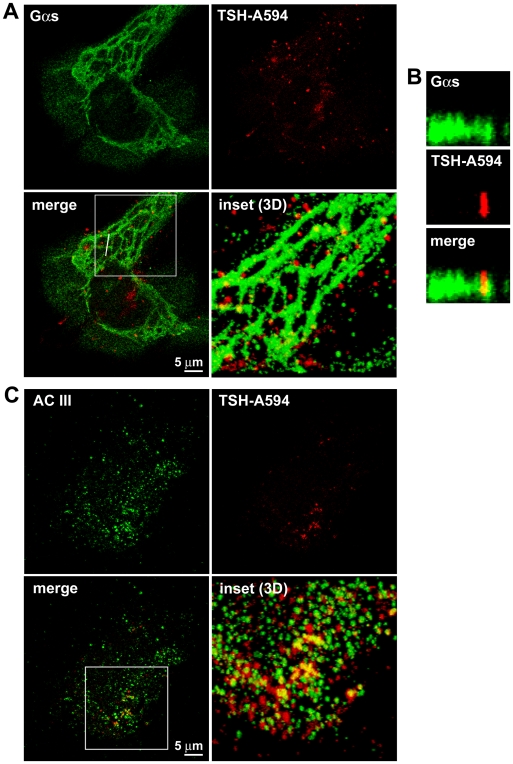
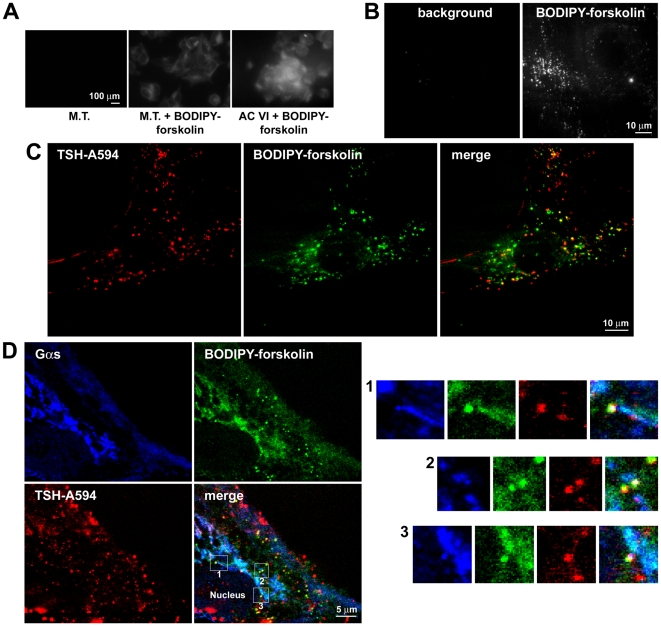
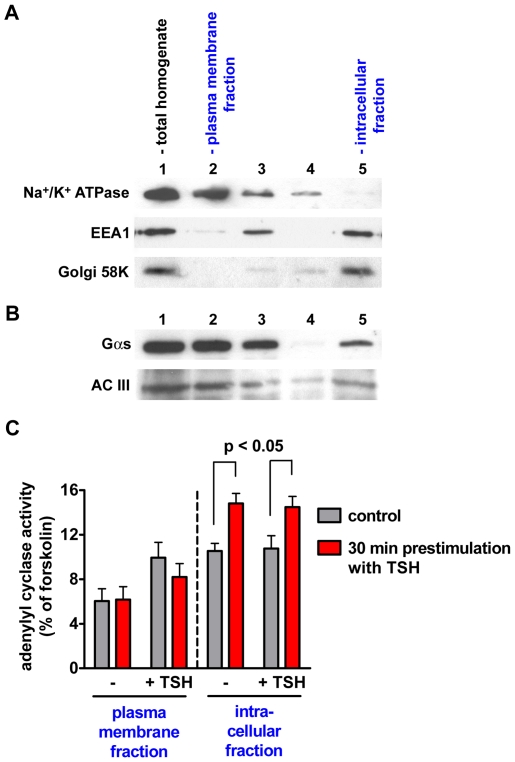
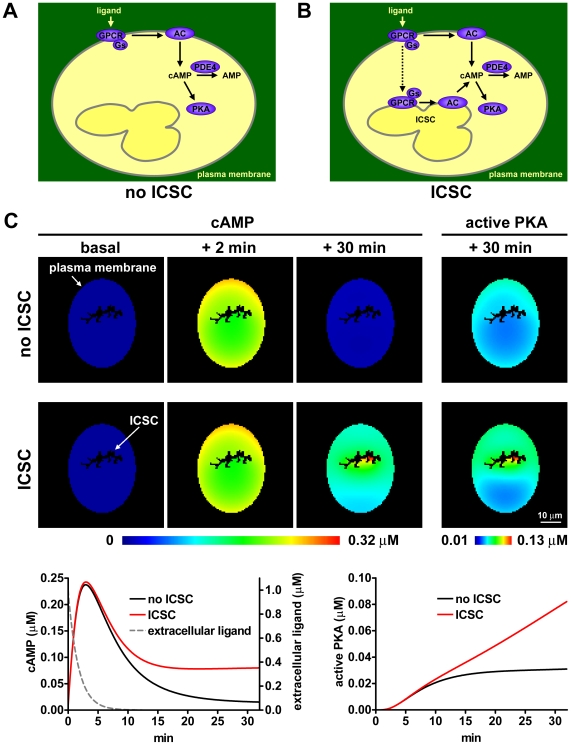
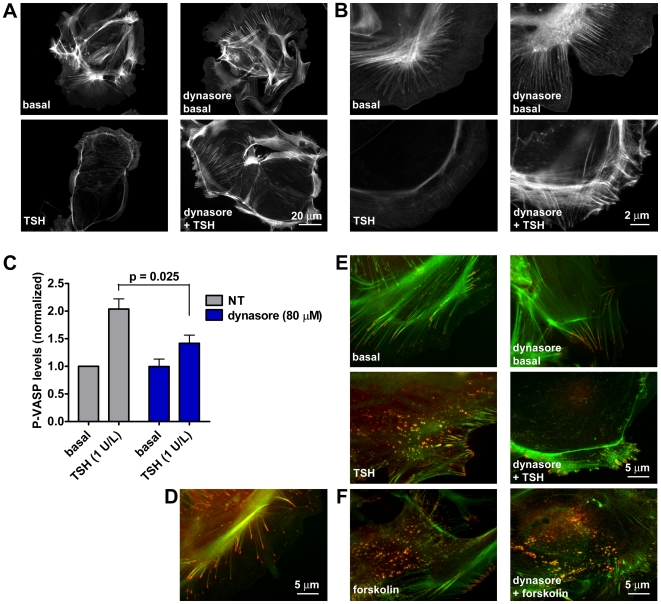
G-protein-coupled receptors (GPCRs) are generally thought to signal to second messengers like cyclic AMP (cAMP) from the cell surface and to become internalized upon repeated or prolonged stimulation. Once internalized, they are supposed to stop signaling to second messengers but may trigger nonclassical signals such as mitogen-activated protein kinase (MAPK) activation. Here, we show that a GPCR continues to stimulate cAMP production in a sustained manner after internalization. We generated transgenic mice with ubiquitous expression of a fluorescent sensor for cAMP and studied cAMP responses to thyroid-stimulating hormone (TSH) in native, 3-D thyroid follicles isolated from these mice. TSH stimulation caused internalization of the TSH receptors into a pre-Golgi compartment in close association with G-protein alpha(s)-subunits and adenylyl cyclase III. Receptors internalized together with TSH and produced downstream cellular responses that were distinct from those triggered by cell surface receptors. These data suggest that classical paradigms of GPCR signaling may need revision, as they indicate that cAMP signaling by GPCRs may occur both at the cell surface and from intracellular sites, but with different consequences for the cell.


Conflict of interest statement

The authors have declared that no competing interests exist.

Figures

Figure 1
Figure 1. Generation and characterization of CAG-Epac1-camps transgenic mice.
(A) Expression cassette used to generate the transgenic mice. The cAMP sensor (Epac1-camps) contains a cAMP binding domain derived from Epac1, flanked on either side by YFP and CFP. The Epac1-camps sensor is under the control of the ubiquitous CAG promoter. (B) Fluorescent image of the head of a transgenic (TG) mouse compared to that of a wild-type (WT) littermate. (C) Fluorescent images of different organs isolated from adult TG and WT mice.
Figure 2
Figure 2. Real-time monitoring of cAMP levels in different types of primary cells isolated from the cAMP reporter mice.
Cells were visualized by time-lapse fluorescence microscopy. The graphs show normalized YFP/CFP ratio values calculated from CFP and YFP images. A reduction of the YFP/CFP ratio is indicative of an increase of cAMP levels. (A) Murine embryonic fibroblasts (MEFs) were stimulated with the β-adrenergic agonist isoproterenol. The cAMP response to isoproterenol was robust but transient due to the activation of PDE4, as indicated by the strong effect of the PDE4-selective inhibitor rolipram. (B) Cortical neurons reacted to isoproterenol and rolipram in a similar way. (C) The response to β-adrenergic stimulation of cardiac cells was further enhanced by rolipram. (D) Peritoneal macrophages showed a more sustained increase in cAMP levels after isoproterenol stimulation and a minor effect of rolipram. (E and F) The isoproterenol effect on cardiac myocytes (E) and macrophages (F) was completely blocked by the β-adrenergic antagonist propranolol. Traces in (A–F) are representative of three to ten experiments per condition.
Figure 3
Figure 3. The thyroid follicle model.
(A) Thyroid follicles constitute the anatomical and functional units of thyroid tissue. They are composed of a monolayer of epithelial cells that defines an inner cavity where thyroid hormones are stored in the form of an iodinated protein (thyroglobulin). Upon binding of TSH to its receptor located on the basolateral membrane, cAMP is produced with consequent activation of PKA and phosphorylation of a series of targets, located in different cellular compartments (e.g., cytosol, nucleus, Golgi complex, apical membrane). These events lead to a fast induction of thyroglobulin reuptake with release of free thyroid hormones into the blood stream and a slow up-regulation of thyroglobulin synthesis and iodination. Thyroid cells are highly polarized, as the basolateral and apical membranes have completely different compositions and extremely specialized functions. (B) Method used to culture thyroid follicles. Isolated mouse thyroid follicles were placed in a glass-bottom Petri dish, coated with a thin layer of collagen gel. Shown are representative images of a single follicle isolated from CAG-Epac1-camps mice after 12 h of culture. Top right, bright field image. Bottom left, maximum projection of YFP fluorescence (corresponding to the Epac1-camps sensor) calculated from individual image slices on the z-axis, captured with a laser-scanning confocal microscope. Bottom right, single confocal image of YFP fluorescence.
Figure 4
Figure 4. Real-time monitoring of cAMP levels in thyroid follicles.
Thyroid follicles isolated from CAG-Epac1-camps mice were visualized by time-lapse fluorescence microscopy. (A) CFP, corrected YFP and YFP/CFP ratio images from a representative sequence, where a thyroid follicle was stimulated with TSH followed by forskolin. (B) Normalized YFP/CFP ratio values obtained from the sequence in (A). (C) Effect of prolonged stimulation with different concentrations of TSH on intracellular cAMP levels. Results in (A–C) are representative of five to ten experiments per condition.
Figure 5
Figure 5. Effect of transient TSH stimulation on cAMP levels.
Thyroid follicles isolated from CAG-Epac1-camps mice were visualized by time-lapse fluorescence microscopy. (A) Effect of repeated short stimuli (10 s each) with TSH. (B–D) Effect of longer TSH applications. Reported are data from representative experiments in which thyroid follicles were stimulated for 30 s (B), 2 min (C), or 10 min (D). (E) Mean FRET changes induced by stimuli as in (B–D). Values were compared by one-way ANOVA. (F) Comparison of signal recovery after stimuli as in (B–D). Signal reversibility was calculated from the YFP/CFP ratio data of the washout phase, by setting the value at the end of TSH stimulation equal to zero and the value before TSH stimulation equal to 100%. The values obtained from different replicates were globally fitted to a first-order exponential function. Fits were compared with F test, having a null hypothesis that Y max values were the same for all datasets. (G) Comparison of Y max values obtained from fitting each dataset in (F) to a first-order exponential equation. Values were compared by one-way ANOVA, followed by Bonferroni post hoc test. Data in (E–G) were obtained from six to eight independent experiments per condition.
Figure 6
Figure 6. Role of PDEs on cAMP signal irreversibility.
(A) Thyroid follicles isolated from CAG-Epac1-camps mice were stimulated with TSH for 10 min followed by extensive washout. Thereafter, a nonselective PDE inhibitor (IBMX) was added to probe the PDE activity. (B) For comparison, the effect of IBMX was evaluated on thyroid follicles that were not previously stimulated with TSH. Shown are representative traces from four to six experiments per condition.
Figure 7
Figure 7. Cointernalization of TSH and its receptor in HEK293 cells.
HEK293 cells transfected with YFP-tagged TSH receptor and β-arrestin 2 were stimulated with 3 µg/ml TSH-Alexa594 for 40 min, fixed, and then visualized by confocal microscopy. “Basal” refers to control cells that were not stimulated with TSH-Alexa594. Images are representative of three independent experiments.
Figure 8
Figure 8. Time-course analysis of TSH receptor internalization.
Primary thyroid cells obtained from CAG-Epac1-camps mice were stimulated with 3 µg/ml TSH-Alexa594 for the indicated period of time, fixed, and then visualized by confocal microscopy. YFP images of Epac1-camps were used as a cytosolic counterstain. Images are representative of 25–30 cells per condition analyzed in four independent experiments.
Figure 9
Figure 9. Dynamic visualization of internalized TSH-Alexa594.
Primary mouse thyroid cells were stimulated with 3 µg/ml TSH-Alexa594 for 20 min. Thereafter, the TSH-Alexa594 fluorescence was visualized with a TIRF microscope set to have a high penetration depth. Shown are three representative frames, acquired at the indicated time points. The arrowhead indicates a tubule that extended during the observation. The merged image was produced by overlaying the images of the three individual frames, after coloring them in red (0 s), green (+38 s) and blue (+49 s). White indicates regions of the image that did not change during this period of time. Data are representative of 20 sequences from four independent experiments.
Figure 10
Figure 10. Colocalization between Gαs and subcellular markers.
(A) Colocalization between Gαs and Alexafluor488-conjugated transferrin (transferrin-Alexa488), used to visualize early and recycling endosomes. Primary mouse thyroid cells were stimulated for various periods of time (2–60 min) with transferrin-Alexa488, followed by immunofluorescence analysis for Gαs. No colocalization was observed at early time points (2–5 min) (unpublished data). At later time points (20–60 min), transferrin appeared to be contained in vesicles associated with the perinuclear tubulovesicular structure positive for Gαs. Some of these vesicles were also positive for Gαs. Reported is a representative image of a cell treated with transferrin-Alexa488 for 20 min. (B) Colocalization between TSH-Alexa594 and transferrin-Alexa488, in a cell that was simultaneously treated with both fluorescent ligands for 20 min. A partial colocalization between TSH-Alexa594 and transferrin-Alexa488 was observed. (C) Colocalization between Gαs and Rab7, used as a marker of late endosomes. Cells were analyzed by double-immunofluorescence with antibodies against Gαs and Rab7. No colocalization was observed. (D) Colocalization between Gαs and Golgi 58K, used as a marker for the Golgi complex. Cells were analyzed by double-immunofluorescence with antibodies against Gαs and Golgi 58K. A high degree of colocalization was observed. Images in (A–D) are representative of more than 20 cells per condition analyzed in at least three independent experiments.
Figure 11
Figure 11. Subcellular localization of Gαs, adenylyl cyclase III, and internalized TSH in primary thyroid cells.
Primary mouse thyroid cells were stimulated with 3 µg/ml TSH-Alexa594 for 10 min, followed by immunofluorescence analysis with antibodies against Gαs (A and B) or adenylyl cyclase III (C). Image stacks on the z-axis were acquired with a laser-scanning confocal microscope. Shown are representative frames. The “3D” in the panels refer to 3-D reconstructions of the areas indicated by the white boxes, calculated from the z-stacks. Here, the reconstructions are observed from the top. To view a complete rotation on the x-axis of the 3D reconstructions, see Videos S4 and S5. (B) Side-view of the z-stack in (A), cut along the white line, showing a Gαs-positive tubule ending in a vesicle positive for both Gαs and TSH-Alexa594. Throughout the figure, yellow in the merged images is indicative of colocalization. Images in (A–C) are representative of 25–30 cells per condition analyzed in at least three independent experiments.
Figure 12
Figure 12. BODIPY-forskolin labeling of adenylyl cyclases.
(A) Test experiment in HEK293 cells. HEK293 cells were either transfected with canine adenylyl cyclase VI cDNA (AC VI) or mock transfected (M.T.). Forty-eight hours after the transfection, they were stained with BODIPY-forskolin and directly visualized with a fluorescent microscope. Note the higher staining in cells overexpressing adenylyl cyclase VI. (B) BODIPY-forskolin labeling of primary thyroid cells. Mouse primary thyroid cells were stained with BODIPY-forskolin and visualized with a TIRF microscope set to have a high penetration depth. (C) Live-cell imaging of adenylyl cyclases and internalized TSH in primary thyroid cells. Primary mouse thyroid cells were stimulated with 3 µg/ml TSH-Alexa594 for 20 min, followed by 10 min staining with BODIPY-forskolin. TSH-Alexa594 and BODIPY-forskolin were visualized with a TIRF microscope as above. A frequent colocalization between TSH-Alexa594 and BODIPY-forskolin on intracellular vesicles and small tubulovesicular structures was observed. (D) Triple staining for adenylyl cyclases, Gαs, and TSH. Mouse primary thyroid cells were stimulated with 3 µg/ml TSH-Alexa594 for 20 min, fixed, and then processed for Gαs immunofluorescence. Immediately before imaging, the coverslips were mounted in an experimental chamber, stained with BODIPY-forskolin, and directly visualized with a confocal microscope. White is indicative of triple colocalization. Images in (A) are representative of three independent experiments. Images in (B–D) are representative of more than 20 cells per condition analyzed in at least three independent experiments.
Figure 13
Figure 13. Effect of endocytosis inhibition on cAMP signaling.
Cells were prestimulated with 0.43 M sucrose for 10 min, 80 µM dynasore for 20 min, or normal medium as control. (A) Comparison of FRET changes induced by stimulating thyroid follicles obtained from CAG-Epac1-camps mice with TSH (30 U/l for 2 min, as in Figure 5C) in the presence or absence (control) of endocytosis inhibitors (n = 6–8 per each condition). Error bars indicate SEM. (B) Confocal image of a primary mouse thyroid cell stimulated with TSH-Alexa594 (3 µg/ml for 20 min) in the presence of 0.43 M sucrose. Note the binding of TSH-Alexa594 to the plasma membrane (arrowheads) and the almost complete inhibition of TSH-Alexa594 internalization (no intracellular vesicles). For comparison, see Figure 8 (20 min). (C) Comparison of cAMP signal reversibility after TSH stimulation (30 U/l for 2 min) in the presence or absence (control) of 0.43 M sucrose (n = 6, each). (D) Confocal image of a primary mouse thyroid cell stimulated with TSH-Alexa594 (3 µg/ml for 20 min) in the presence of 80 µM dynasore, showing consistent inhibition of TSH-Alexa594 internalization. Arrowheads, TSH-Alexa594 bound to the plasma membrane. (E) Comparison of cAMP signal reversibility after TSH stimulation (30 U/l for 2 min) in the presence or absence (control) of 80 µM dynasore (n = 6, control; n = 8, dynasore). Signal reversibility in (C) and (E) is calculated as in Figure 5F. Fits were compared with F test, having a null hypothesis that Y max values were the same for all datasets. Images in (B) and (D) are representative of more than 20 cells per condition analyzed in three independent experiments.
Figure 14
Figure 14. Cell fractionation experiments.
The plasma membrane and the intracellular fractions of FRTL5 cells were obtained by separation with concanavalin A-coated magnetic beads. (A) Western blot analysis of subcellular markers in the obtained fractions. The following markers were used: Na+/K+ATPase for the plasma membrane, the early endosome antigen 1 (EEA1) for early endosomes, and Golgi 58K for the Golgi complex. 1, total homogenate. 2, first eluate from the magnetic beads, corresponding to the plasma membrane fraction. 3, postnuclear supernatant. 4, second eluate from the magnetic beads. 5, intracellular fraction. (B) Western blot for Gαs and adenylyl cyclase III (AC III) in the same fractions as in (A). (C) Effect of TSH stimulation on adenylyl cyclase activity in the subcellular fractions. FRTL5 cells were starved for 24 h in medium without TSH and either stimulated with 30 U/l TSH for 30 min or mock stimulated (control), followed by cell fractionation with concanavalin A-coated magnetic beads. The adenylyl cyclase activity in the plasma membrane and intracellular fractions was then determined in the absence of stimuli (−) or in the presence of either 30 U/l TSH (+TSH) or 10 µM forskolin. The results were normalized for the maximal adenylyl cyclase activity measured in the presence of forskolin. Shown are the data from three independent experiments. Error bars indicate SEM.
Figure 15
Figure 15. Mathematical model of the GPCR-cAMP signaling pathway.
A model of spatial partial differential equations was generated to simulate the temporal and spatial dynamics of GPCR signaling. (A) Schematic illustration of the basic model. The receptor, G-proteins, and adenylyl cyclase are placed on the plasma membrane, whereas ATP, cAMP, and PDE4 are freely diffusing in the cytosol. PKA is cytosolic, but nondiffusing. (B) Model with the addition of an intracellular signaling compartment (ICSC). To simulate GPCR-cAMP signaling from an ICSC, we placed G-proteins and adenylyl cyclase also on an intracellular membrane and simulated the internalization of both GPCR and ligand to this compartment. (C) Results of simulations. A cell was transiently stimulated by application and removal of the ligand from the extracellular compartment. In a first simulation in which signaling from the ICSC was not implemented (no ICSC), the cAMP response was completely reversible. On the contrary, inclusion of the ICSC in the model lead to sustained cAMP production. Also note the different levels and spatial patterns of PKA activation predicted in the presence or absence of the ICSC.
Figure 16
Figure 16. Effect of endocytosis inhibition on downstream signaling.
(A and B) Actin depolymerization in response to TSH. Mouse primary thyroid cells were preincubated with normal medium or medium plus 80 µM dynasore for 20 min and stimulated with 30 U/l TSH for an additional 20 min in the presence or absence of dynasore as indicated. Cells were then fixed, and actin was stained with fluorescent phalloidin. Note that dynasore largely prevented the depolymerization of actin in response to TSH. (B) High-magnification images of actin rearrangement in lamellipodia, where the effect of dynasore was more pronounced. (C) VASP phosphorylation. Primary mouse thyroid cells were preincubated with normal medium or medium plus 80 µM dynasore for 20 min. Cells were then stimulated with 1 U/l TSH for 30 min, in the presence or absence of dynasore as indicated. Levels of P-VASP (Ser 157) and total VASP were evaluated by Western blot analysis. Shown are the mean P-VASP levels of three independent experiments. Error bars indicate SEM. (D) Subcellular localization of VASP. Mouse primary thyroid cells were labeled by immunofluorescence with an antibody against total VASP (red) together with fluorescent phalloidin to stain actin (green). Shown is a merged fluorescent image. VASP is typically located at the ends of actin filaments. (E) Pattern of VASP phosphorylation in response to TSH. Mouse primary thyroid cells were preincubated and stimulated with TSH in the presence or absence of dynasore as explained above. Cells were then labeled by immunofluorescence with an antibody against VASP phosphorylated at Ser 157 (red) together with fluorescent phalloidin to stain actin (green). Note the appearance of spots containing phosphorylated VASP and actin in the central cellular compartment only in the absence of dynasore. (F) Actin depolymerization and pattern of VASP phosphorylation in response to forskolin. Cells were treated as in (E), with the exception that instead of TSH, they were stimulated with 10 µM forskolin. Note a similar degree of actin depolymerization and a similar pattern of VASP phosphorylation both in the presence and in the absence of dynasore. Images in (A and B) and (D–F) are representative of at least three independent experiments.

Similar articles

Cited by

References

    1. Pierce K. L, Premont R. T, Lefkowitz R. J. Seven-transmembrane receptors. Nat Rev Mol Cell Biol. 2002;3:639–650. - PubMed
    1. Pippig S, Andexinger S, Lohse M. J. Sequestration and recycling of beta 2-adrenergic receptors permit receptor resensitization. Mol Pharmacol. 1995;47:666–676. - PubMed
    1. Sorkin A, von Zastrow M. Signal transduction and endocytosis: close encounters of many kinds. Nat Rev Mol Cell Biol. 2002;3:600–614. - PubMed
    1. Miaczynska M, Pelkmans L, Zerial M. Not just a sink: endosomes in control of signal transduction. Curr Opin Cell Biol. 2004;16:400–406. - PubMed
    1. Polo S, Di Fiore P. P. Endocytosis conducts the cell signaling orchestra. Cell. 2006;124:897–900. - PubMed

Publication types

MeSH terms