beta1 integrin maintains integrity of the embryonic neocortical stem cell niche
- PMID: 19688041
- PMCID: PMC2720642
- DOI: 10.1371/journal.pbio.1000176
beta1 integrin maintains integrity of the embryonic neocortical stem cell niche
Abstract
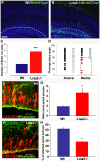
During embryogenesis, the neural stem cells (NSC) of the developing cerebral cortex are located in the ventricular zone (VZ) lining the cerebral ventricles. They exhibit apical and basal processes that contact the ventricular surface and the pial basement membrane, respectively. This unique architecture is important for VZ physical integrity and fate determination of NSC daughter cells. In addition, the shorter apical process is critical for interkinetic nuclear migration (INM), which enables VZ cell mitoses at the ventricular surface. Despite their importance, the mechanisms required for NSC adhesion to the ventricle are poorly understood. We have shown previously that one class of candidate adhesion molecules, laminins, are present in the ventricular region and that their integrin receptors are expressed by NSC. However, prior studies only demonstrate a role for their interaction in the attachment of the basal process to the overlying pial basement membrane. Here we use antibody-blocking and genetic experiments to reveal an additional and novel requirement for laminin/integrin interactions in apical process adhesion and NSC regulation. Transient abrogation of integrin binding and signalling using blocking antibodies to specifically target the ventricular region in utero results in abnormal INM and alterations in the orientation of NSC divisions. We found that these defects were also observed in laminin alpha2 deficient mice. More detailed analyses using a multidisciplinary approach to analyse stem cell behaviour by expression of fluorescent transgenes and multiphoton time-lapse imaging revealed that the transient embryonic disruption of laminin/integrin signalling at the VZ surface resulted in apical process detachment from the ventricular surface, dystrophic radial glia fibers, and substantial layering defects in the postnatal neocortex. Collectively, these data reveal novel roles for the laminin/integrin interaction in anchoring embryonic NSCs to the ventricular surface and maintaining the physical integrity of the neocortical niche, with even transient perturbations resulting in long-lasting cortical defects.
Conflict of interest statement
The authors have declared that no competing interests exist.
Figures


Similar articles
-
Patterns of laminins and integrins in the embryonic ventricular zone of the CNS.J Comp Neurol. 2007 Dec 20;505(6):630-43. doi: 10.1002/cne.21520. J Comp Neurol. 2007. PMID: 17948866
-
Molecular and morphological heterogeneity of neural precursors in the mouse neocortical proliferative zones.J Neurosci. 2006 Jan 18;26(3):1045-56. doi: 10.1523/JNEUROSCI.4499-05.2006. J Neurosci. 2006. PMID: 16421324 Free PMC article.
-
Oblique radial glial divisions in the developing mouse neocortex induce self-renewing progenitors outside the germinal zone that resemble primate outer subventricular zone progenitors.J Neurosci. 2011 Mar 9;31(10):3683-95. doi: 10.1523/JNEUROSCI.4773-10.2011. J Neurosci. 2011. PMID: 21389223 Free PMC article.
-
Postnatal development of radial glia and the ventricular zone (VZ): a continuum of the neural stem cell compartment.Cereb Cortex. 2003 Jun;13(6):580-7. doi: 10.1093/cercor/13.6.580. Cereb Cortex. 2003. PMID: 12764031 Review.
-
Cytoarchitecture of mouse and human subventricular zone in developing cerebral neocortex.Exp Brain Res. 2012 Jan;216(2):161-8. doi: 10.1007/s00221-011-2933-3. Epub 2011 Nov 13. Exp Brain Res. 2012. PMID: 22080150 Free PMC article. Review.
Cited by
-
Harnessing the potential of adult cardiac stem cells: lessons from haematopoiesis, the embryo and the niche.J Cardiovasc Transl Res. 2012 Oct;5(5):631-40. doi: 10.1007/s12265-012-9386-3. Epub 2012 Jun 15. J Cardiovasc Transl Res. 2012. PMID: 22700450 Review.
-
Enhancing Therapeutic Efficacy of Oncolytic Herpes Simplex Virus-1 with Integrin β1 Blocking Antibody OS2966.Mol Cancer Ther. 2019 Jun;18(6):1127-1136. doi: 10.1158/1535-7163.MCT-18-0953. Epub 2019 Mar 29. Mol Cancer Ther. 2019. PMID: 30926634 Free PMC article.
-
Combining insoluble and soluble factors to steer stem cell fate.Nat Mater. 2014 Jun;13(6):532-7. doi: 10.1038/nmat3997. Nat Mater. 2014. PMID: 24845982 Review. No abstract available.
-
Radial glia progenitor polarity in health and disease.Front Cell Dev Biol. 2024 Oct 2;12:1478283. doi: 10.3389/fcell.2024.1478283. eCollection 2024. Front Cell Dev Biol. 2024. PMID: 39416687 Free PMC article. Review.
-
The vascular stem cell niche: roadmap for transplanted neural progenitor cells during environmental enrichment?Neural Regen Res. 2015 Aug;10(8):1204-5. doi: 10.4103/1673-5374.162692. Neural Regen Res. 2015. PMID: 26487836 Free PMC article. No abstract available.
References
-
- Temple S. The development of neural stem cells. Nature. 2001;414:112–117. - PubMed
-
- Kriegstein A. R, Noctor S. C. Patterns of neuronal migration in the embryonic cortex. Trends Neurosci. 2004;27:392–399. - PubMed
-
- Levitt P, Rakic P. Immunoperoxidase localization of glial fibrillary acidic protein in radial glial cells and astrocytes of the developing rhesus monkey brain. J Comp Neurol. 1980;193:815–840. - PubMed
-
- Rakic P. Elusive radial glial cells: historical and evolutionary perspective. Glia. 2003;43:19–32. - PubMed
-
- Kamei Y, Inagaki N, Nishizawa M, Tsutsumi O, Taketani Y, et al. Visualization of mitotic radial glial lineage cells in the developing rat brain by Cdc2 kinase-phosphorylated vimentin. Glia. 1998;23:191–199. - PubMed
Publication types
MeSH terms
Substances
Grants and funding
LinkOut - more resources
Full Text Sources
Medical
Molecular Biology Databases

