

The impact of boundary spanning scholarly publications and patents
- PMID: 19688087
- PMCID: PMC2722725
- DOI: 10.1371/journal.pone.0006547
The impact of boundary spanning scholarly publications and patents
Abstract
Background: Human knowledge and innovation are recorded in two media: scholarly publication and patents. These records not only document a new scientific insight or new method developed, but they also carefully cite prior work upon which the innovation is built.
Methodology: We quantify the impact of information flow across fields using two large citation dataset: one spanning over a century of scholarly work in the natural sciences, social sciences and humanities, and second spanning a quarter century of United States patents.
Conclusions: We find that a publication's citing across disciplines is tied to its subsequent impact. In the case of patents and natural science publications, those that are cited at least once are cited slightly more when they draw on research outside of their area. In contrast, in the social sciences, citing within one's own field tends to be positively correlated with impact.
Conflict of interest statement
Figures
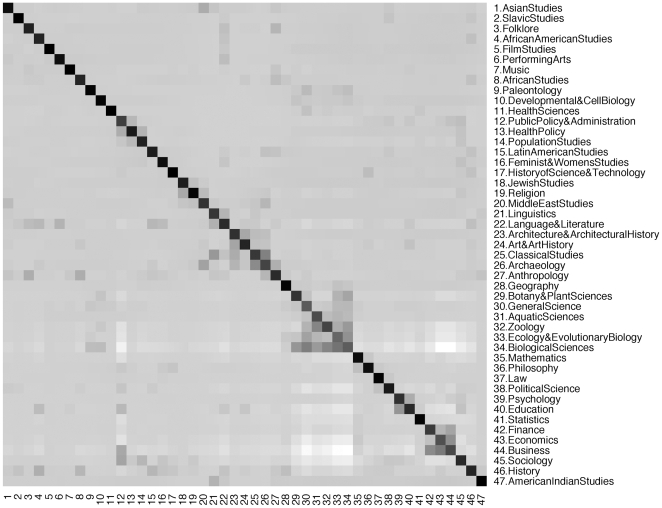
 , the Z-score, corresponding to the
  row and
  column. Each entry is shaded according to a normalized Z-score representing whether the number of citations between disciplines is higher or lower than expected at random. Darker shading represents higher Z-scores. The diagonal represents citations within the same discipline.
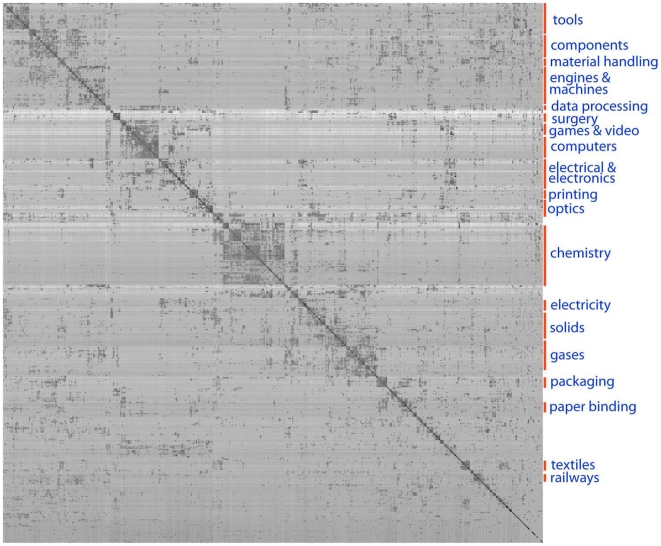
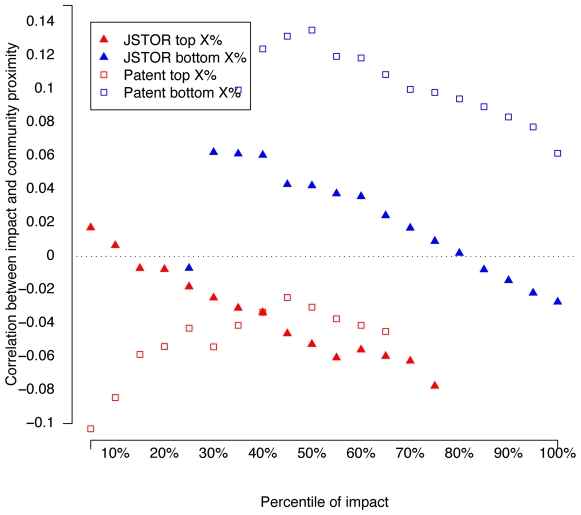
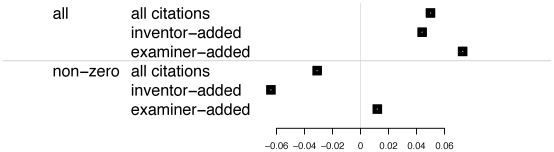
 for the bottom 20% of publications by their impact
  , and for the top 20% by
  . No correlations are shown for the bottom 10–20% of publications because they received no citations.
Similar articles
-
The increasing dominance of teams in production of knowledge.Science. 2007 May 18;316(5827):1036-9. doi: 10.1126/science.1136099. Epub 2007 Apr 12. Science. 2007. PMID: 17431139
-
Citations in Life Science Patents to Publicly Funded Research at Academic Medical Centers.Clin Transl Sci. 2015 Dec;8(6):759-63. doi: 10.1111/cts.12361. Clin Transl Sci. 2015. PMID: 26728947 Free PMC article.
-
The Oligopoly of Academic Publishers in the Digital Era.PLoS One. 2015 Jun 10;10(6):e0127502. doi: 10.1371/journal.pone.0127502. eCollection 2015. PLoS One. 2015. PMID: 26061978 Free PMC article.
-
Journal impact factor: a bumpy ride in an open space.J Investig Med. 2020 Jan;68(1):83-87. doi: 10.1136/jim-2019-001009. Epub 2019 Jun 26. J Investig Med. 2020. PMID: 31248943 Review.
-
The distribution of forensic journals, reflections on authorship practices, peer-review and role of the impact factor.Forensic Sci Int. 2007 Jan 17;165(2-3):115-28. doi: 10.1016/j.forsciint.2006.05.013. Epub 2006 Jun 19. Forensic Sci Int. 2007. PMID: 16784827 Review.
Cited by
-
Understanding crowd-powered search groups: a social network perspective.PLoS One. 2012;7(6):e39749. doi: 10.1371/journal.pone.0039749. Epub 2012 Jun 27. PLoS One. 2012. PMID: 22761888 Free PMC article.
-
Evaluating interdisciplinary research: Disparate outcomes for topic and knowledge base.Proc Natl Acad Sci U S A. 2025 Apr 22;122(16):e2409752122. doi: 10.1073/pnas.2409752122. Epub 2025 Apr 18. Proc Natl Acad Sci U S A. 2025. PMID: 40249787 Free PMC article.
-
Interdisciplinary research has consistently lower funding success.Nature. 2016 Jun 30;534(7609):684-7. doi: 10.1038/nature18315. Nature. 2016. PMID: 27357795
-
Food-pharma convergence in medical nutrition- best of both worlds?PLoS One. 2013 Dec 16;8(12):e82609. doi: 10.1371/journal.pone.0082609. eCollection 2013. PLoS One. 2013. PMID: 24358214 Free PMC article.
-
Dynamic academic networking concept and its links with English language skills and research productivity-non-Anglophone context.PLoS One. 2021 Feb 2;16(2):e0245980. doi: 10.1371/journal.pone.0245980. eCollection 2021. PLoS One. 2021. PMID: 33529212 Free PMC article.
References
-
- Dieks D, Chang H. Differences in Impact of Scientific Publications: Some Indices Derived from a Citation Analysis. Social Studies of Science. 1976;6:247–267.
-
- de Solla Price D. Networks of Scientific Papers. Science. 1965;149:510–515. - PubMed
-
- Boyack K, Klavans R, Börner K. Mapping the backbone of science. Scientometrics. 2005;64:351–374.
Publication types
MeSH terms
LinkOut - more resources
Full Text Sources
Molecular Biology Databases
