Dual-pressure linear ion trap mass spectrometer improving the analysis of complex protein mixtures
- PMID: 19689114
- PMCID: PMC2810160
- DOI: 10.1021/ac901278y
Dual-pressure linear ion trap mass spectrometer improving the analysis of complex protein mixtures
Abstract
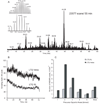
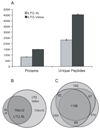
The considerable progress in high-throughput proteomics analysis via liquid chromatography-electrospray ionization-tandem mass spectrometry over the past decade has been fueled to a large degree by continuous improvements in instrumentation. High-throughput identification experiments are based on peptide sequencing and are largely accomplished through the use of tandem mass spectrometry, with ion trap and trap-based instruments having become broadly adopted analytical platforms. To satisfy increasingly demanding requirements for depth of characterization and throughput, we present a newly developed dual-pressure linear ion trap mass spectrometer (LTQ Velos) that features increased sensitivity, afforded by a new source design, and demonstrates practical cycle times 2 times shorter than that of an LTQ XL, while improving or maintaining spectral quality for MS/MS fragmentation spectra. These improvements resulted in a substantial increase in the detection and identification of both proteins and unique peptides from the complex proteome of Caenorhabditis elegans, as compared to existing platforms. The greatly increased ion flux into the mass spectrometer in combination with improved isolation of low-abundance precursor ions resulted in increased detection of low-abundance peptides. These improvements cumulatively resulted in a substantially greater penetration into the baker's yeast (Saccharomyces cerevisiae) proteome compared to LTQ XL. Alternatively, faster cycle times on the new instrument allowed for higher throughput for a given depth of proteome analysis, with more peptides and proteins identified in 60 min using an LTQ Velos than in 180 min using an LTQ XL. When mass analysis was carried out with resolution in excess of 25,000 full width at half-maximum (fwhm), it became possible to isotopically resolve a small intact protein and its fragments, opening possibilities for top down experiments.
Figures


Similar articles
-
Performance evaluation of a dual linear ion trap-Fourier transform ion cyclotron resonance mass spectrometer for proteomics research.J Proteomics. 2013 Aug 2;88:109-19. doi: 10.1016/j.jprot.2013.04.009. Epub 2013 Apr 13. J Proteomics. 2013. PMID: 23590889 Free PMC article.
-
Implementation of electron-transfer dissociation on a hybrid linear ion trap-orbitrap mass spectrometer.Anal Chem. 2007 May 15;79(10):3525-34. doi: 10.1021/ac070020k. Epub 2007 Apr 19. Anal Chem. 2007. PMID: 17441688 Free PMC article.
-
Comparison of data acquisition strategies on quadrupole ion trap instrumentation for shotgun proteomics.J Am Soc Mass Spectrom. 2014 Dec;25(12):2048-59. doi: 10.1007/s13361-014-0981-1. Epub 2014 Sep 27. J Am Soc Mass Spectrom. 2014. PMID: 25261218 Free PMC article.
-
Screening of synthetic PDE-5 inhibitors and their analogues as adulterants: analytical techniques and challenges.J Pharm Biomed Anal. 2014 Jan;87:176-90. doi: 10.1016/j.jpba.2013.04.037. Epub 2013 May 6. J Pharm Biomed Anal. 2014. PMID: 23721687 Review.
-
The effect of the mobile phase additives on sensitivity in the analysis of peptides and proteins by high-performance liquid chromatography-electrospray mass spectrometry.J Chromatogr B Analyt Technol Biomed Life Sci. 2005 Oct 25;825(2):111-23. doi: 10.1016/j.jchromb.2005.03.041. Epub 2005 Apr 26. J Chromatogr B Analyt Technol Biomed Life Sci. 2005. PMID: 16213445 Review.
Cited by
-
PEPPI-MS: Polyacrylamide-Gel-Based Prefractionation for Analysis of Intact Proteoforms and Protein Complexes by Mass Spectrometry.J Proteome Res. 2020 Sep 4;19(9):3779-3791. doi: 10.1021/acs.jproteome.0c00303. Epub 2020 Jul 11. J Proteome Res. 2020. PMID: 32538093 Free PMC article.
-
A Theoretical Method for Characterizing Nonlinear Effects in Paul Traps with Added Octopole Field.J Am Soc Mass Spectrom. 2015 Aug;26(8):1338-48. doi: 10.1007/s13361-015-1145-7. Epub 2015 Apr 30. J Am Soc Mass Spectrom. 2015. PMID: 25924875
-
Sub-part-per-million precursor and product mass accuracy for high-throughput proteomics on an electron transfer dissociation-enabled orbitrap mass spectrometer.Mol Cell Proteomics. 2010 May;9(5):754-63. doi: 10.1074/mcp.M900541-MCP200. Epub 2010 Feb 2. Mol Cell Proteomics. 2010. PMID: 20124352 Free PMC article.
-
Sprayed water microdroplets containing dissolved pyridine spontaneously generate pyridyl anions.Proc Natl Acad Sci U S A. 2022 Mar 22;119(12):e2200991119. doi: 10.1073/pnas.2200991119. Epub 2022 Mar 14. Proc Natl Acad Sci U S A. 2022. PMID: 35286201 Free PMC article.
-
Enhanced performance of pulsed Q collision induced dissociation-based peptide identification on a dual-pressure linear ion trap.J Am Soc Mass Spectrom. 2012 Jan;23(1):186-9. doi: 10.1007/s13361-011-0256-z. Epub 2011 Oct 27. J Am Soc Mass Spectrom. 2012. PMID: 22033888
References
Publication types
MeSH terms
Substances
Grants and funding
LinkOut - more resources
Full Text Sources
Other Literature Sources
Molecular Biology Databases
Miscellaneous

