Multicenter Study
. 2009 Aug;6(4):347-61.
doi: 10.2174/156720509788929273.

Baseline MRI predictors of conversion from MCI to probable AD in the ADNI cohort

Affiliations
Multicenter Study

Baseline MRI predictors of conversion from MCI to probable AD in the ADNI cohort

Shannon L Risacher et al. Curr Alzheimer Res. 2009 Aug.

Abstract

The Alzheimer's Disease Neuroimaging Initiative (ADNI) is a multi-center study assessing neuroimaging in diagnosis and longitudinal monitoring. Amnestic Mild Cognitive Impairment (MCI) often represents a prodromal form of dementia, conferring a 10-15% annual risk of converting to probable AD. We analyzed baseline 1.5T MRI scans in 693 participants from the ADNI cohort divided into four groups by baseline diagnosis and one year MCI to probable AD conversion status to identify neuroimaging phenotypes associated with MCI and AD and potential predictive markers of imminent conversion. MP-RAGE scans were analyzed using publicly available voxel-based morphometry (VBM) and automated parcellation methods. Measures included global and hippocampal grey matter (GM) density, hippocampal and amygdalar volumes, and cortical thickness values from entorhinal cortex and other temporal and parietal lobe regions. The overall pattern of structural MRI changes in MCI (n=339) and AD (n=148) compared to healthy controls (HC, n=206) was similar to prior findings in smaller samples. MCI-Converters (n=62) demonstrated a very similar pattern of atrophic changes to the AD group up to a year before meeting clinical criteria for AD. Finally, a comparison of effect sizes for contrasts between the MCI-Converters and MCI-Stable (n=277) groups on MRI metrics indicated that degree of neurodegeneration of medial temporal structures was the best antecedent MRI marker of imminent conversion, with decreased hippocampal volume (left > right) being the most robust. Validation of imaging biomarkers is important as they can help enrich clinical trials of disease modifying agents by identifying individuals at highest risk for progression to AD.


Figures
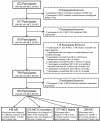
Fig. (1)
Fig. (1)
Flowchart of participant pool selection with group exclusion and inclusion criteria.
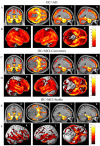
Fig. (2). Group comparisons of healthy control participants and patient groups using a one-way ANOVA of GM density maps.
Selected slices (A) and surface renderings (B) of regions where HC>AD. Selected slices (C) and surface renderings (D) of regions where HC>MCI-Converters. Selected slices (E) and surface renderings (F) of regions where HC>MCI-Stable. All comparisons are displayed at a threshold of p<0.005 (FDR), k=27. Age, gender, years of education, handedness and ICV were included as covariates in all comparisons. Selected sections for (A), (C), and (E) include left to right MNI coordinates: (0, -9, 0, coronal), (0, -23, -16, axial), (-26, -10, -15, sagittal), and (26, -10, -15, sagittal).
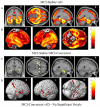
Fig. (3). Group comparisons of patient groups based on baseline diagnosis and one year conversion status using a one-way ANOVA of GM density maps.
Selected slices (A) and surface renderings (B) of regions where MCI-Stable>AD. Selected slices (C) and surface renderings (D) of regions where MCI-Stable>MCI-Converters. No significant voxels were found in the comparison between MCI-Converters and AD participants. All comparisons are displayed at a threshold of p<0.005 (FDR), k=27. Using a more lenient statistical threshold, differences were apparent in the posterior parietal and occipital lobes (data not shown). Age, gender, years of education, handedness and ICV were included as covariates in all comparisons. Selected sections for (A) and (C) include left to right MNI coordinates: (0, -9, 0, coronal), (0, -23, -16, axial), (-26, -10, -15, sagittal), and (26, -10, -15, sagittal).
Fig. (4). Extracted GM density, volume, and cortical thickness values from medial temporal lobe structures.
Comparisons of GM density values (A) were extracted from the unmodulated VBM GM maps using standard left and right hippocampal ROIs traced on an independent sample of 40 HC participants [25, 58]. Bilateral hippocampal (B) and amygdalar (C) volume estimates and entorhinal cortex thickness values (D) were extracted using automated parcellation. The comparisons of all four MRI metrics show a significant difference (p<0.001) across all groups. In pairwise comparisons, hippocampal GM density, hippocampal and amygdala volumes, and entorhinal cortex thickness show significant differences between HC and all clinical groups (p<0.001) bilaterally and MCI-Stable and AD groups (p<0.001) bilaterally. Furthermore, MCI-Stable and MCI-Converter groups show significant differences in GM density and volume in the left (GM (A), p=0.001; volume (B), p<0.001) and right (GM (A), p=0.034; volume (B), p<0.001) hippocampi, as well as significant differences in amygdala volume on both the left (p<0.001) and right (p=0.01). MCI-Converters also showed significantly thinner entorhinal cortices than MCI-Stable participants on both the left (p=0.006) and right (p<0.001). No significant differences were found in hippocampal GM density, hippocampal or amygdalar volumes, or entorhinal cortex thickness values between MCI-Converter and AD groups. Age, gender, years of education, handedness, and ICV were included as covariates in all comparisons.
Fig. (5). Cortical thickness values from the temporal lobe extracted using automated parcellation.
Comparisons between cortical thickness values from three regions of the temporal lobe, including inferior (A), middle (B), and superior (C) temporal gyri, demonstrated significant differences (p<0.001) across all groups. Pairwise comparisons demonstrated significant differences in cortical thickness values for all temporal gyri bilaterally between HC and all other groups (p<0.001), as well as between the MCI-Stable and AD groups (p<0.001). The MCI-Converter and MCI-Stable groups also showed significant differences in cortical thickness in bilateral inferior temporal gyri (p<0.001), left (p<0.001) and right (p=0.001) middle temporal gyri, and left (p=0.003) and right (p=0.002) superior temporal gyri. Cortical thickness values from bilateral inferior, middle, and superior temporal gyri were not significantly different between the MCI-Converter and AD groups. Age, gender, years of education, handedness, and ICV were included as covariates in all comparisons.
Fig. (6). Parietal cortical thickness values extracted using automated parcellation.
Cortical thickness values from the inferior parietal gyrus (A) and precuneus (B) showed significant differences between groups (p<0.001). Pairwise comparisons showed significant differences in bilateral inferior parietal gyrus and precuneus between HC and all clinical groups (p<0.001), as well as between the MCI-Stable and AD groups (p<0.001). The MCI-Stable and MCI-Converter groups were significantly different in the left (p=0.006) and right (p=0.009) inferior parietal gyri and left (p=0.012) and right (p=0.013) precuneus. No significant difference was found between MCI-Converter and AD groups in either region. Age, gender, years of education, handedness and ICV were included as covariates in all comparisons.
Fig. (7). Effect sizes of the comparison between MCI-Stable and MCI-Converter groups evaluated for selected imaging biomarkers.
GM density, volume, and cortical thickness were extracted using VBM and automated parcellation and compared between sub-groups based on MCI to AD conversion status after one year. Effect sizes (Cohen’s d) of comparisons between MCI-Stable and MCI-Converter groups showed that imaging biomarkers from the temporal lobe, including hippocampal and amygdalar volume and cortical thickness values from the entorhinal cortex and inferior, middle, and superior temporal gyri, provided the greatest statistical difference. Age, gender, handedness, education, and ICV were included as covariates and adjusted bilateral means were used to calculate effect size.

References

    1. Ferri CP, Prince M, Brayne C, Brodaty H, Fratiglioni L, Ganguli M, et al. Global prevalence of dementia: a delphi consensus study. Lancet. 2005;366:2112–2117. - PMC - PubMed
    1. Wimo A, Winblad B, Aguero-Torres H, von Strauss E. The magnitude of dementia occurrence in the world. Alzheimer Dis Assoc Disord. 2003;17:63–67. - PubMed
    1. Petersen RC. Mild cognitive impairment as a diagnostic entity. J Intern Med. 2004;256:183–194. - PubMed
    1. Petersen RC, Smith GE, Waring SC, Ivnik RJ, Tangalos EG, Kokmen E. Mild cognitive impairment: clinical characterization and outcome. Arch Neurol. 1999;56:303–308. - PubMed
    1. Jack CR Jr, Bernstein MA, Fox NC, Thompson P, Alexander G, Harvey D, et al. The Alzheimer's disease neuroimaging initiative (ADNI): MRI methods. J Magn Reson Imaging. 2008;27:685–691. - PMC - PubMed

Publication types

MeSH terms