

Statistical methods for gene set co-expression analysis
- PMID: 19689953
- PMCID: PMC2781749
- DOI: 10.1093/bioinformatics/btp502
Statistical methods for gene set co-expression analysis
Abstract
Motivation: The power of a microarray experiment derives from the identification of genes differentially regulated across biological conditions. To date, differential regulation is most often taken to mean differential expression, and a number of useful methods for identifying differentially expressed (DE) genes or gene sets are available. However, such methods are not able to identify many relevant classes of differentially regulated genes. One important example concerns differentially co-expressed (DC) genes.
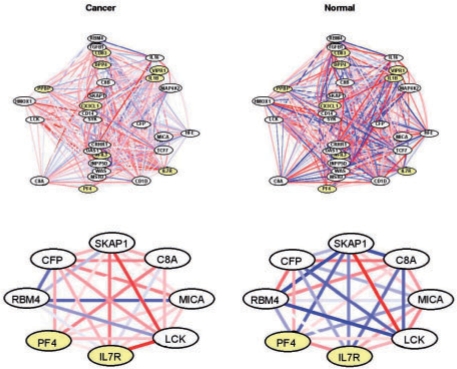
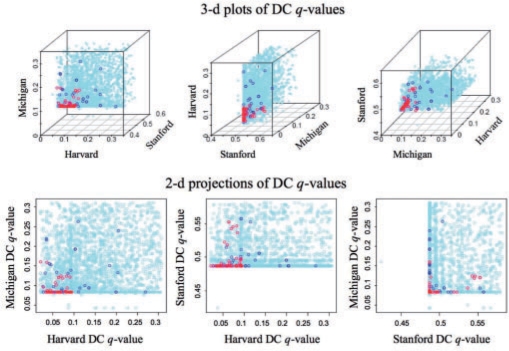
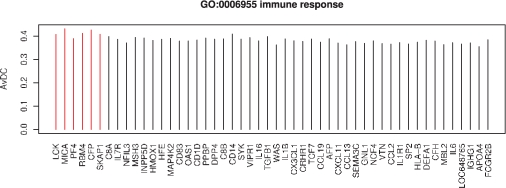
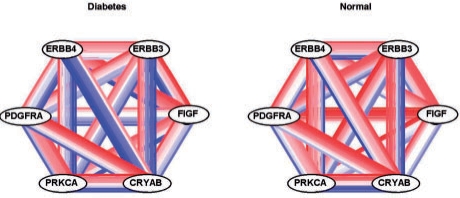
Results: We propose an approach, gene set co-expression analysis (GSCA), to identify DC gene sets. The GSCA approach provides a false discovery rate controlled list of interesting gene sets, does not require that genes be highly correlated in at least one biological condition and is readily applied to data from individual or multiple experiments, as we demonstrate using data from studies of lung cancer and diabetes.
Availability: The GSCA approach is implemented in R and available at www.biostat.wisc.edu/ approximately kendzior/GSCA/.
Contact: kendzior@biostat.wisc.edu
Supplementary information: Supplementary data are available at Bioinformatics online.
Figures

References
-
- Allison DB, et al. Microarray data analysis: from disarray to consolidation and consensus. Nat. Rev. Genet. 2006;7:55–65. - PubMed
-
- Ariyanayagam-Baksh SM, et al. Malignant blue nevus: a case report and molecular analysis. Am. J. Dermatopathol. 2003;25:21–27. - PubMed
-
- Barry WT, et al. Significance analysis of functional categories in gene expression studies: a structured permutation approach. Bioinformatics. 2005;21:1943–1949. - PubMed
-
- Barry WT, et al. A statistical framework for testing functional categories in microarray data. Ann. Appl. Stat. 2008;2:286–315.
-
- Beer DG, et al. Gene-expression profiles predict survival of patients with lung adenocarcinoma. Nat. Med. 2002;8:816–824. - PubMed
Publication types
MeSH terms
Grants and funding
LinkOut - more resources
Full Text Sources
Other Literature Sources
