. 2009 Sep 15;122(Pt 18):3250-61.
doi: 10.1242/jcs.053207. Epub 2009 Aug 18.

Sequential signaling in plasma-membrane domains during macropinosome formation in macrophages

Affiliations

Sequential signaling in plasma-membrane domains during macropinosome formation in macrophages

Sei Yoshida et al. J Cell Sci. .

Abstract

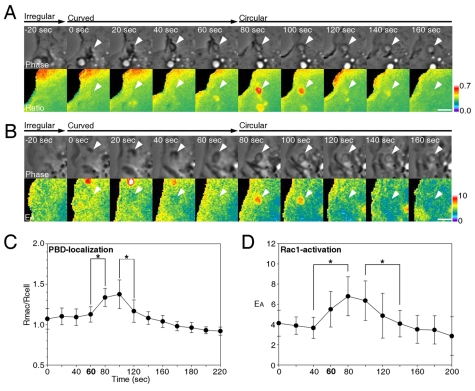
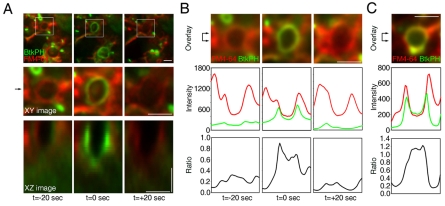
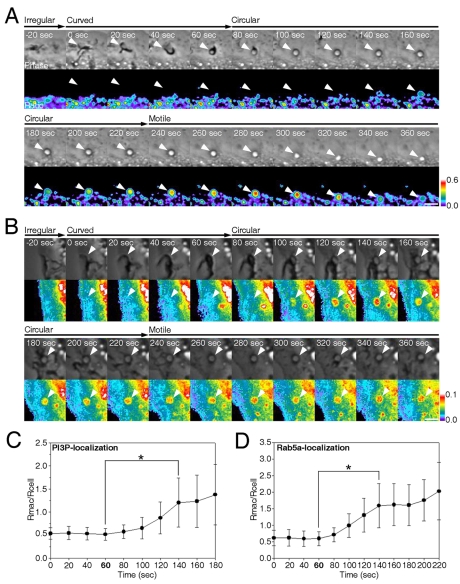
Macropinosomes are large endocytic vesicles that form in ruffling regions of plasma membrane. To analyze signal organization relative to ruffle closure into circular ruffles and cup closure into macropinosomes, this study used quantitative microscopy to measure 3' phosphoinositides and small-GTPase activities in a representative subset of forming macropinosomes. Macropinocytosis was stimulated by the addition of macrophage colony-stimulating factor (M-CSF) to macrophages expressing fluorescent reporter proteins. Ratiometric and fluorescence resonance energy transfer (FRET) microscopy determined that Rac1 activity and phosphatidylinositol (3,4,5)-trisphosphate [PtdIns(3,4,5)P(3)] levels increased transiently, peaking 26-30 seconds after ruffle closure. Three-dimensional reconstruction of cells labeled with the fluorescent dye FM4-64 showed that PtdIns(3,4,5)P(3) was restricted to open, circular cups in the plasma membrane. Quantitative fluorescence microscopic methods determined the timing of cup closure, which followed 40-100 seconds after Rac1 and PtdIns(3,4,5)P(3) deactivation and coincided with accumulation of phosphatidylinositol 3-phosphate and Rab5a. Thus, ruffle closure creates a circular domain of plasma membrane that localizes the activation and deactivation of Rac1 and phosphoinositide 3-kinase (PI3K), followed by recruitment of Rab5a and the contractile activities of cup closure.


Figures

Fig. 1.
Fig. 1.
A quantitative model of macropinosome formation. (A) Typical phase-contrast images of macropinosome formation (white arrows). Irregular ruffles were phase-dense bands at the periphery of the cells (+0 sec to +40 sec), which changed into curved ruffles (+60 sec). A curved ruffle (white arrow) closed into a circular ruffle (+120 sec), then moved centripetally after a 100-second pause (+220 sec). These morphological transitions were divided into four stages of macropinosome formation: irregular, curved, circular and motile. Scale bar: 3 μm. (B) The size distribution of 65 macropinosomes, defined as the diameter at the first frame of the circular ruffle stage. (C) The frequency of macropinosome formation. The x-axis indicates the time of the beginning of the curved stage, relative to the addition of M-CSF. (D) Macropinosomes in the size range of 1.2- to 2.2-μm diameter were analyzed (n=41), with the beginning of the curved stage set to 0 seconds. (E) The subset of macropinosomes used to evaluate signaling (1.2-2.2 μm, 60-second curved-ruffle stage). The beginning of the curved-ruffle stage was set as time=0. (F) Diagram of the two stages of macropinosome closure. The top row shows a side view and the bottom row shows a top view (as observed in the microscope, A) of plasma membrane and macropinosome membranes. Ruffle closure is the formation of a complete circular ruffle, comprised entirely of plasma membrane; ruffle closure marks the beginning of the circular stage. Cup closure marks the separation of the macropinosome from the plasma membrane sometime after ruffle closure.
Fig. 2.
Fig. 2.
Rac1 dynamics in macropinocytic cups. (A) Ratiometric imaging of YFP-PBD and CFP. Phase-contrast (Phase) and ratiometric (Ratio) images of BM-macrophages expressing YFP-PBD with soluble CFP during macropinosome formation. `0 sec' marks the beginning of the curved stage. Scale bar: 3 μm. Color bars indicate the molar ratio of YFP-PBD:CFP. The ratio of YFP-PBD:CFP at the area of macropinosome formation increased at 80 seconds. Arrowheads indicate a forming macropinosome. (B) FRET stoichiometry imaging of YFP-Rac1 activation during macropinosome formation. Phase-contrast (Phase) and EA images of a BM-macrophage expressing YFP-Rac1 and CFP-PBD. EA is proportional to the fraction of Rac1-YFP bound to PBD-CFP. EA values were high at 80 and 100 seconds. Scale bar: 3 μm. Color bars indicate values in the EA images. (C) Plots of average Rmac:Rcell, indicating the dynamics of YFP-PBD localization on macropinosomes (n=10). The differences between the localization index of YFP-PBD at 60 and 80 seconds (*P<0.001) and at 100 and 120 seconds were significant (*P<0.001). Error bars indicate standard deviation. (D) Plots of average EA values on macropinosomes (n=10). The differences between the values at 40 and 80 seconds and also 100 and 140 seconds were significant (*P<0.001), indicating that Rac1 was activated at areas of macropinosome formation from 60 to 100 seconds. Error bars indicate standard deviation.
Fig. 3.
Fig. 3.
PtdIns(3,4,5)P3 dynamics during macropinosome formation. (A) Phase-contrast (Phase) and ratiometric (Ratio) images of macropinosome formation in BM-macrophages expressing YFP-BtkPH and CFP. Indicated times are relative to the beginning of the curved-ruffle stage. Arrowheads indicate a forming macropinosome. Color bars indicate the molar ratio of YFP-chimera:CFP in the ratio images. The YFP-BtkPH:CFP ratios increased at 60 and 80 seconds and returned to baseline at 100 seconds. Scale bar: 4 μm. (B) Plots of Rmac:Rcell in six cells, indicating the dynamics of YFP-BtkPH on macropinosomes. 60 seconds marks the end of the curved-ruffle stage (i.e. ruffle closure). YFP-BtkPH localization increased transiently after 60 seconds. (C) Plot of average Rmac:Rcell. The differences between the localization indices of YFP-BtkPH at 60 and 80 seconds (*P<0.01) and also that at 80 and 100 seconds were statistically significant (*P<0.05), indicating that PtdIns(3,4,5)P3 (PIP3) was transiently generated after 60 seconds. Error bars indicate standard deviation. (D) The dynamics of a PtdIns(3,4,5)P3 spike in a macrophage expressing YFP-BtkPH and CFP-MEM. Images were collected every 3 seconds; 6-second intervals are depicted. PtdIns(3,4,5)P3 concentrations in the plasma membrane began to increase shortly after ruffle closure (66 sec). Scale bar: 1 μm.
Fig. 4.
Fig. 4.
The PtdIns(3,4,5)P3 spike was restricted to the inside of the circular ruffle. Macropinosome formation in macrophages expressing YFP-BtkPH in the presence of FM4-64 dye was observed in 3D reconstructions. Complete z-axis image stacks were collected every 20 seconds, then the image series were deconvolved to observe PtdIns(3,4,5)P3 spikes in three dimensions. Red and green in each panel indicate the localization of FM4-64 and YFP-BtkPH, respectively. Scale bars: 2 μm. (A) 3D image reconstruction of a PtdIns(3,4,5)P3 spike. Top panels are xy-projections of reconstructed cell images. Squares in the top panels indicate the macropinosome areas that are enlarged in the corresponding middle panels. Bottom panels are xz-images of the areas indicated by the arrow in the middle panels. YFP-BtkPH fluorescence appeared transiently in the circular ruffle at t=0 seconds. (B) Quantitative analysis of fluorophore distributions. Deconvolved images were compressed to display total signal intensities along the z-axis (top panels). Resulting images were line-scanned along the x-axis through the center of the macropinosome (bracket-shaped arrow of top panels) and corresponding intensities along the x-axis were plotted in the middle panels. On the basis of these traces, ratios of YFP-BtkPH fluorescence to FM4-64 fluorescence were calculated (bottom panels). Comparing the middle and bottom panels indicates that the increased ratios at t=0 seconds were restricted to the membrane between the two peaks (green line) of the FM4-64 curve. (C) Another PtdIns(3,4,5)P3 spike on a deconvolved and overlaid image (top panel), with fluorescence intensities line-scanned along the x-axis through the center of the cup. The x-axis corresponds with the position of the bracket-shaped arrow in the top panels. The ratio of YFP-BtkPH to FM4-64 fluorescence was calculated (bottom panels). High ratio values were restricted to the membrane between the two peaks of the FM4-64 curve (green line).
Fig. 5.
Fig. 5.
The PtdIns(3,4,5)P3 spike precedes cup closure. (A) Strategy for identifying the point of cup closure using CFP-MEM-labeled membranes. The top row shows the arrangements of plasma membrane on the top of the cell during macropinosome formation. The bottom row shows the corresponding fluorescence intensity of CFP-MEM during ruffling and macropinosome formation. Fluorescence intensities should increase as the membrane doubles over, reaching maximal values at the point of cup closure. (B) Macropinosome formation in macrophages expressing YFP-BtkPH and CFP-MEM. Arrowheads indicate a forming macropinosome. The top row shows phase-contrast images of the stages of macropinosome formation. The middle row shows the relative density of membrane, as indicated by the intensity of the CFP-MEM images. CFP-MEM fluorescence in the macropinosome increased during the circular stage, indicative of membrane doubling and cup closure. The bottom row shows the YFP-BtkPH:CFP-MEM ratio, which indicates the spike of PtdIns(3,4,5)P3 concentration in membranes just after ruffle closure (red arrowhead). Scale bar: 3 μm. Color bars indicate the signal intensity of CFP-MEM or the molar ratio of YFP-BtkPH:CFP-MEM in each image. (C) Timing of the peak values for YFP-BtkPH:CFP-MEM ratios and CFP-MEM fluorescence, relative to ruffle closure (t=0 seconds), indicated that the maximal fluorescence of CFP-MEM followed the PtdIns(3,4,5)P3 spike (n=ten macropinosomes). The difference between two maxima was significant (*P<0.005). (D) Strategy for identifying cup closure using low concentrations of FM4-64. The top row shows the relative fluorescence of plasma membrane and macropinosome membranes under observation conditions. Plasma membranes will remain fluorescent owing to exchange of FM4-64 with dye in the buffer. Macropinosome closure will limit the reservoir of free FM4-64 to that which is enclosed in the vacuole; hence, the macropinosome fluorescence will diminish faster than the plasma-membrane fluorescence. Cup closure can be identified as the point at which macropinosome fluorescence photobleaches faster than plasma-membrane fluorescence. (E) Photobleaching of FM4-64 in macropinosomes revealed the timing of cup closure relative to the PtdIns(3,4,5)P3 spike. Macrophages expressing YFP-BtkPH were imaged in the presence of M-CSF and 1 μg/ml FM4-64. The top row shows phase-contrast images of the stages of macropinosome formation. The middle row shows the intensity of YFP-BtkPH. YFP-BtkPH fluorescence in the macropinosome increased at t=+20 seconds (relative to ruffle closure), indicative of the PtdIns(3,4,5)P3 spike. The bottom row shows the intensity of FM4-64, which indicates the relative membrane densities in each pixel. FM4-64 fluorescence in the plasma membrane decreased continuously owing to photobleaching and depletion of dye from the buffer. FM4-64 fluorescence in the macropinosome increased during the curved stage then decreased gradually during the circular stage. Scale bar: 3 μm. Color bars indicate the signal intensities of YFP-BtkPH or FM4-64 in each image. (F) Plots of YFP-BtkPH signal intensity in the macropinosome region (black circles) and the entire cell (white circles) of C. Time 0 marks ruffle closure. (G) Intensity of macropinosome (MP):intensity of whole cell area (Cell) for YFP-BtkPH fluorescence (white circles) and FM4-64 fluorescence (black circles) of A. Relative FM4-64 fluorescence in the macropinosome increased during ruffle and cup closure, then decreased afterwards. The point at which the ratio began to decrease indicated cup closure. Comparing the two curves indicates that the PtdIns(3,4,5)P3 spike occurred between ruffle closure (t=0 seconds) and cup closure (t=+100 seconds). (H) Intensity (MP):intensity (Cell) for FM4-64 fluorescence, relative to ruffle closure (t=0 seconds), the PtdIns(3,4,5)P3 spike (spike), the maximum ratio (peak) and the end of the circular stage (end), indicated that cup closure followed the spike of PtdIns(3,4,5)P3 (n=nine macropinosomes). *P<0.01, **P<0.005, ***P<0.001.
Fig. 6.
Fig. 6.
PtdIns(3)P and Rab5a localization during macropinosome formation. (A) Phase-contrast (Phase) and ratiometric (Ratio) images of macropinosome formation in BM-macrophages expressing YFP-2×FYVE and CFP to localize PtdIns(3)P (PI3P). Indicated times are relative to the beginning of the curved-ruffle stage. Arrowhead indicates a forming macropinosome. Color bars indicate the molar ratio of YFP-2×FYVE:CFP in the ratio images. Scale bar: 3 μm. YFP-2×FYVE:CFP ratios increased after 140 seconds. (B) Ratiometric imaging of YFP-Rab5a localization during macropinosome formation in a BM-macrophage expressing YFP-Rab5a and CFP. `0 sec' marks the beginning of the curved-ruffle stage. Color bar indicates the molar ratio of YFP-Rab5a:CFP in the ratio images. Scale bar: 3 μm. The ratio of YFP-Rab5a:CFP increased on the macropinosome after 100 seconds. (C) Plots of average Rmac:Rcell, indicating the dynamics of YFP-2×FYVE on macropinosomes (n=10). 60 seconds marks the end of the curved-ruffle stage. YFP-2×FYVE localization continuously increased after 60 seconds. The difference between the localization index of YFP-2×FYVE at 60 and 140 seconds was significant (*P<0.005). Error bars indicate standard deviation. (D) Plots of average Rmac:Rcell indicate the dynamics of YFP-Rab5a localization to macropinosomes (n=10). Rab5a localization continuously increased after 60 seconds. The difference between the localization index of YFP-Rab5a at 60 and 140 seconds was significant (*P<0.005). Error bars indicate standard deviation.
Fig. 7.
Fig. 7.
Signaling on incompletely formed macropinosomes. (A) The effect of LY294002 on signaling in cups. Top two rows: phase-contrast (top) and YFP-PBD:CFP ratios (bottom) in macrophages treated with 50 μM LY294002 (30 minutes) then M-CSF. YFP-PBD was recruited to ruffles and cups, but the cups failed to close into macropinosomes. Bottom two rows: phase-contrast and YFP-Rab5a in LY294002-treated macrophages. YFP-Rab5a was not recruited to the cup. (B) Recruitment of YFP-PBD (top two rows) and YFP-BtkPH (bottom two rows) to cups, which failed to close into macropinosomes. YFP-PBD localized to the cup in an irregular temporal pattern. YFP-BtkPH did not localize to the cup. Arrowheads indicate a forming macropinosome. Scale bars: 3 μm.
Fig. 8.
Fig. 8.
Summary of the timing and relationship between morphology changes and signals during macropinosome formation. Graph shows the measured average times for the component activities. Independent of the time of addition of M-CSF, PtdIns(3,4,5)P3 (PIP3) and Rac1 activities peaked shortly after ruffle closure. Deactivation of Rac1 and PtdIns(3,4,5)P3 signals coincided with the appearance of Rab5a and PtdIns(3)P (PI3P). Recruitment of Rab5a, and possibly also PtdIns(3)P, to macropinocytic cups began prior to cup closure, which preceded the motile stage. The timing of the signals relative to the morphology suggests that the PtdIns(3,4,5)P3-Rac1 spike requires ruffle closure and that the decrease of PtdIns(3,4,5)P3 or the increase of PtdIns(3)P regulates cup closure.

References

    1. Amyere, M., Payrastre, B., Krause, U., van der Smissen, P., Veithen, A. and Courtoy, P. J. (2000). Constitutive macropinocytosis in oncogene-transformed fibroblasts depends on sequential permanent activation phosphoinositide 3-kinase and phospholipase C. Mol. Biol. Cell 11, 3453-3467. - PMC - PubMed
    1. Araki, N., Johnson, M. T. and Swanson, J. A. (1996). A role for phosphoinositide 3-kinase in the completion of macropinocytosis and phagocytosis by macrophages. J. Cell Biol. 135, 1249-1260. - PMC - PubMed
    1. Araki, N., Hatae, T., Furukawa, A. and Swanson, J. A. (2003). Phosphoinositide-3-kinase-independent contractile activites associated with Fcγ-receptor-mediated phagocytosis and macropinocytosis in macrophages. J. Cell Sci. 116, 247-257. - PubMed
    1. Araki, N., Hamasaki, M., Egami, Y. and Hatae, T. (2006). Effect of 3-methylamide on the fusion process of macropinosomes in EGF-stimulated A431 cells. Cell Struct. Funct. 31, 145-157. - PubMed
    1. Araki, N., Egami, Y., Watanabe, Y. and Hatae, T. (2007). Phosphoinositide metabolism during membrane ruffling and macropinosome formation in EGF-stimulated A431 cells. Exp. Cell Res. 313, 1496-1507. - PubMed

Publication types

Substances