. 2009 Sep;119(9):2634-47.
doi: 10.1172/JCI38864. Epub 2009 Aug 17.

Acquisition of the contractile phenotype by murine arterial smooth muscle cells depends on the Mir143/145 gene cluster

Affiliations

Acquisition of the contractile phenotype by murine arterial smooth muscle cells depends on the Mir143/145 gene cluster

Thomas Boettger et al. J Clin Invest. 2009 Sep.

Abstract

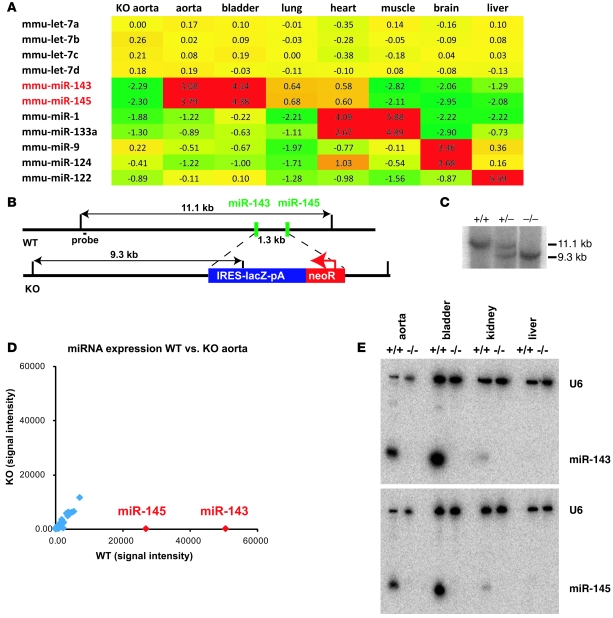
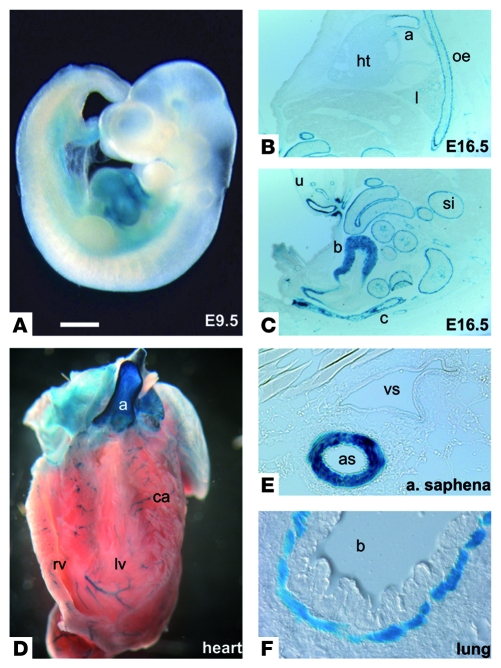
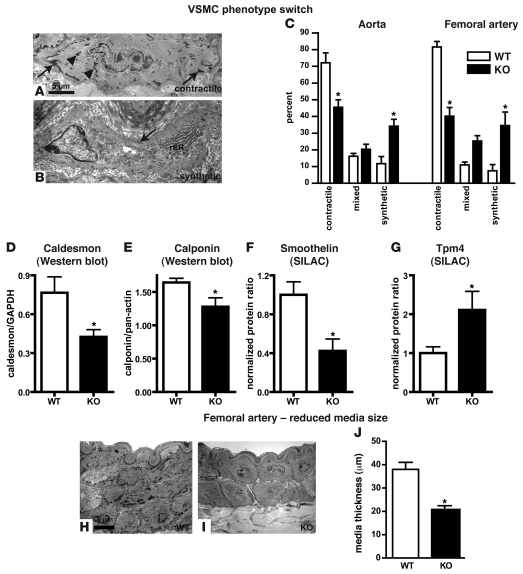
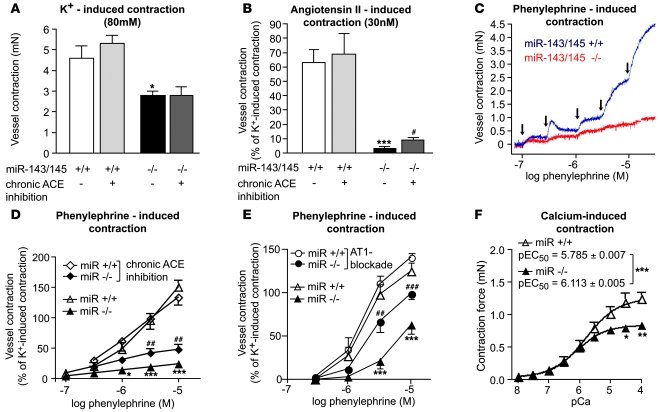
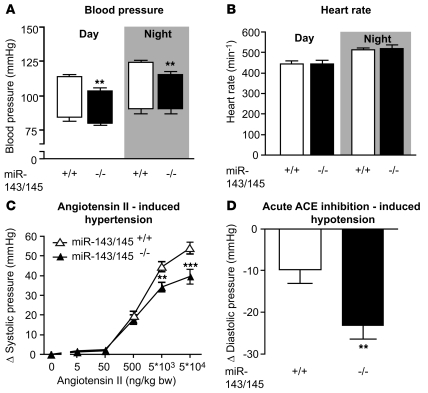
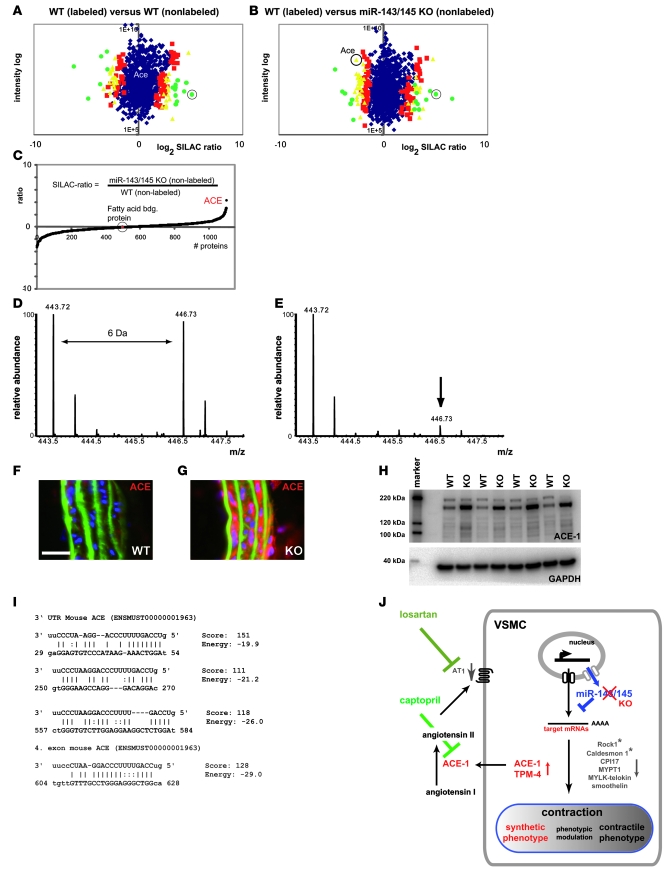
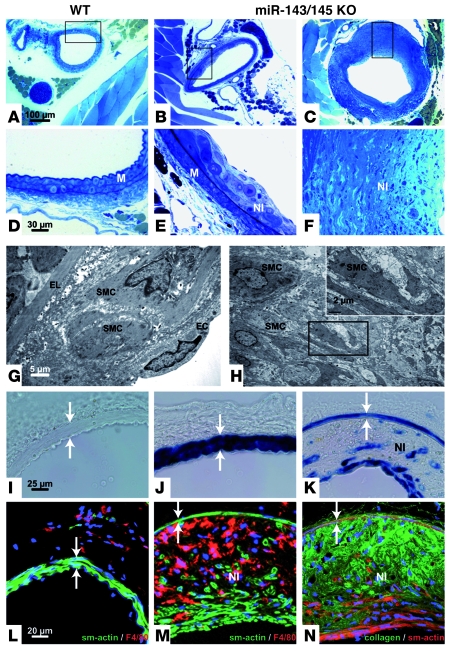
VSMCs respond to changes in the local environment by adjusting their phenotype from contractile to synthetic, a phenomenon known as phenotypic modulation or switching. Failure of VSMCs to acquire and maintain the contractile phenotype plays a key role in a number of major human diseases, including arteriosclerosis. Although several regulatory circuits that control differentiation of SMCs have been identified, the decisive mechanisms that govern phenotypic modulation remain unknown. Here, we demonstrate that the mouse miR-143/145 cluster, expression of which is confined to SMCs during development, is required for VSMC acquisition of the contractile phenotype. VSMCs from miR-143/145-deficient mice were locked in the synthetic state, which incapacitated their contractile abilities and favored neointimal lesion development. Unbiased high-throughput, quantitative, mass spectrometry-based proteomics using reference mice labeled with stable isotopes allowed identification of miR-143/145 targets; these included angiotensin-converting enzyme (ACE), which might affect both the synthetic phenotype and contractile functions of VSMCs. Pharmacological inhibition of either ACE or the AT1 receptor partially reversed vascular dysfunction and normalized gene expression in miR-143/145-deficient mice. We conclude that manipulation of miR-143/145 expression may offer a new approach for influencing vascular repair and attenuating arteriosclerotic pathogenesis.


Figures

Figure 1
Figure 1. Microarray analysis of miR-143/145 expression and targeting strategy of the miR-143/145 cluster.
(A) miRNA microarray analysis of different mouse tissues. Expression values are ratios of tissue-specific miRNA expression versus reference miRNA from an E15.5 mouse embryo. The miRNAs show a similar expression profile in different organs. The miR-1/133a cluster, miR-124/miR-9, and miR-122 are known markers of heart/muscle, brain, and liver, respectively. mmu, Mus musculus. (B) The miR-143 and miR-145 sequences are separated by a 1.3-kb fragment on mouse chromosome 18. Both miRNAs were deleted by insertion of an IRES-lacZ-NeoR cassette. EcoRV restriction fragments used for genotyping are indicated. (C) Southern blot analysis of WT, heterozygous, and KO animals using the 5ι outside probe and EcoRV-digested genomic DNA. (D) Microarray analysis of miRNA expression of a WT versus KO aorta. Results of 2 microarray experiments with dye swapping for WT and KO mice are shown. The arrays were normalized to a ratio of medians of one for the let-7 signals, and the results of the 2 experiments were combined by calculating the mean of signals after reversion of all ratios (1/x) of the dye swap control experiment. miR-143 and miR-145 are shown in red; other miRNAs of the aorta are in blue. (E) Northern blot analysis of miRNA expression in WT and KO tissues. Blots were probed with radioactively labeled U6/miR-143 and U6/miR-145, respectively.
Figure 2
Figure 2. The miR-143/145 cluster is specifically expressed in the SMC lineage.
(AF) Specific expression of the lacZ reporter gene under control of the miR-143 promoter in SMCs. (A) miR-143/145 is initially expressed in the developing embryonic heart at E8.5 (not shown) to E9.5. (B and C) During fetal stages (E16.5), the expression of the miR-143 reporter gene becomes confined to SMCs of the aorta (a), smaller blood vessels, esophagus (oe), lung (l), small intestine (si), colon (c), bladder (b), and umbilical cord (u). (DF) In adult animals, miR-143 expression is present in all SMCs throughout the body, including the aorta, the coronary arteries (ca) of the cross-sectioned heart, the saphenous artery (as), and the bronchi (b). Scale bar in A: 0.6 mm (A); 0.9 mm (B and C); 1.2 mm (D); 0.09 mm (E); 0.06 mm (F).
Figure 3
Figure 3. SMCs of Mir143/145-KO mice show a shift from a contractile to a synthetic phenotype and reduced media thickness.
(A and B) Ultrastructural features of contractile and synthetic SMCs. (A) Typical contractile SMCs from WT animals show numerous focal adhesions (arrows) and intracellular dense bodies (arrowheads). (B) In contrast, synthetic SMCs from mutant mice only rarely display focal adhesions (arrow) and intracellular dense bodies and are rich in rough ER (rER). (C) Relative numbers of synthetic and contractile VSMCs in aorta and femoral artery. The number of synthetic SMCs is increased in the aorta and femoral arteries of KO mice. *P < 0.05; 300 cells per genotype were analyzed. (DG) Quantification of markers of contractile SMCs (DF) and synthetic SMCs (G). *P < 0.05 in D, E, and G; n = 3 WT, n = 3 KO mutant. *P < 0.0001 in F, n = 8 WT, n = 7 KO mutant. (H and I) EM pictures of cross sections through the femoral artery. Note the presence of contractile and synthetic SMCs in WT and mutant vessel walls, respectively. (J) Quantification of media thicknesses. *P < 0.05, n = WT, n = 3 KO mutant. Error bars indicate ± SEM.
Figure 4
Figure 4. In vitro evaluation of contractile properties of isolated femoral artery rings mounted in a myograph.
(A) Vessel contraction induced by extracellular potassium was reduced to 61% of the WT response (n = 12 WT and n = 8 KO vessels, *P < 0.05). No change in contraction after potassium-induced depolarization was observed after treatment with captopril (n = 8 WT and n = 9 KO vessels). (B) Vessel contraction induced by angiotensin II was significantly blunted in mutant arteries. Pretreatment with captopril significantly improved angiotensin II–induced contractile responses (n = 12 WT and n = 9 KO vessels of untreated animals, ***P < 0.0001, KO untreated vs. WT untreated; n = 8 WT and n = 9 KO vessels of captopril-treated animals, #P < 0.05 KO treated vs. KO untreated). (C and D) Isolated arteries stimulated with increasing concentrations of phenylephrine. Arrows indicate applications of phenylephrine. (D) Statistical analysis of phenylephrine and captopril responses. Captopril treatment improved responses of the KO vessels (n = 12 WT and n = 8 KO vessels of untreated animals, *P < 0.05, ***P < 0.001, KO untreated vs. WT untreated; n = 8 WT and n = 0 KO vessels of captopril-treated animals, ##P < 0.01 KO treated vs. KO untreated). (E) Contractile responses to phenylephrine stimulation of mesenteric arteries. Arterial rings from KO animals showed a significant enhancement in contractility after AT1 receptor blockade by losartan (n = 7 WT and n = 8 KO vessels from untreated animals, ***P < 0.001, KO untreated vs. WT untreated; n = 10 WT and n = 8 KO vessels from losartan-treated animals, ##P < 0.01, ###P > 0.001, KO treated vs. KO untreated). (F) pCa-force relationships in skinned femoral arteries. Maximal Ca2+-induced contraction was blunted in KO arteries, and the pEC50 values significantly shifted leftward in KO skinned arteries (n = 12 WT and n = 8 KO vessels, *P < 0.05, **P < 0.01, ***P < 0.001, KO vs. WT). Error bars indicate ± SEM.
Figure 5
Figure 5. Hemodynamic measurements.
(A and B) In vivo blood pressure and heart rate measurements by telemetry. (A) Boxes show blood pressure amplitudes, with upper line representing systolic pressure and lower line, diastolic pressure; error bars indicate SEM. Systolic blood pressure was significantly reduced in miR-143/145–deficient mice during day- and nighttime periods (n = 6 WT and n = 7 KO, **P < 0.01), while diastolic pressure did not differ significantly between genotypes. (B) No difference in heart rate was observed between genotypes. (C) During isoflurane anesthesia, angiotensin II induced a larger increase in systolic blood pressure in WT (n = 12) than in KO mice (n = 13) (**P < 0.01, ***P < 0.001). (D) Acute inhibition of ACE by captopril lead to a greater decrease in diastolic pressure in miR-143/145–deficient animals (n = 11 WT and n = 13 KO, **P < 0.01). Error bars indicate ± SEM.
Figure 6
Figure 6. ACE is a target of miR-145.
Analysis of protein expression by SILAC mouse–based quantitative proteomics and Western blot analysis. (A and B) SILAC-labeled (13C6Lys) WT aorta was mixed with nonlabeled WT aorta (A) and miR-143/145 KO aorta (B). Protein ratios are plotted against added peptide intensities. Blue dots represent proteins that do not show a significant change in expression levels (P ≥ 0.05). Red, yellow, and green dots represent proteins with a significant change in expression levels at different confidence intervals (red: P < 0.05, yellow: P < 0.01, green: P < 0.001). Circled green dots in A and B indicate fatty acid–binding protein. (C) To obtain ratios between nonlabeled WT and nonlabeled Mir143/145-KO aortae, both ratios from 13C6Lys-WT/WT (nonlabeled) and 13C6Lys-WT/miR-143/145 KO (non-labeled) were divided by each other. (D and E) Mass spectra of an ACE-1 peptide [YVEFSNK (MH2+)] SILAC pair with 13C6Lys-WT/WT (D) and a pair 13C6Lys-WT/Mir143/145-KO (E). Peaks with lower molecular weight correspond to the unlabeled peptide; peaks with higher molecular weight (greater than 6 Da) correspond to the 13C6Lys peptide. Calculation of ACE-1 signals from all samples revealed a 4.9-fold upregulation of ACE-1 in KO vs. WT aortae (n = 3 per genotype, P < 0.01; see Supplemental Table 1). (F and G) Immunofluorescence analysis of ACE expression in cryosections of aorta (scale bar: 25 μm). (H) Western blot analysis of ACE-1 expression in WT and Mir143/145-KO aortae (n = 4 per genotype, P < 0.001, KO/WT ratio: 4.3). (I) miR-145 binding sites in the 3ι UTR and ORF of ACE predicted by the miRanda algorithm. (J) Schematic representation of the role of miR-143/145 in VSMCs.
Figure 7
Figure 7. Mir143/145-KO mice develop neointimal lesions.
(AC) Sections of WT (A) and KO (B and C) femoral arteries are shown (scale bar, 100 μm); boxed regions are magnified in DF (scale bar, 30 μm). Electron micrographs of early and late lesions are shown in G and H, respectively. Scale bars: 5 μm (G), 2 μm (H, inset). (IK) Femoral artery of WT (I), heterozygous (J), and homozygous animals (K) stained for β-galactosidase activity to indicate miR-143/145 locus activity (scale bar, 25 μm). (L and M) Sections of WT (L) and KO vessels (M). Sections of the femoral artery stained with antibodies against α-SMA or the macrophage marker F8/40. (N) Sections of the femoral artery stained with antibodies against α-SMA and collagen I. Scale bar: 20 μm (LN). Lesions were frequently found in KO animals but not in WT animals. (G) Formation of neointima with SMCs and macrophages (not shown) between the lamina elastica and endothelial cells. Lesions at later stages reached large volumes and showed a thinned media (IN, arrows) but no constriction of the vessel. Note the absence of foam cells or lipophilic inclusions (G and H), which was also indicated by the absence of Sudan IV staining (not shown). SMCs were recognized by morphology (G and H), by anti–smooth muscle staining (M and N), or by lacZ transgene expression under the control of the miR-143/145 locus (K). The plaques contain macrophages identified by the F4/80 marker (M) and deposits of amorphous collagen (N). Smooth muscle (G) and macrophages were also identified in early lesions (not shown). EL, elastic lamina; NI neointima. Scale bars: 25 μm (IK); 20 μm (LN).

Comment in

References

    1. Owens G.K., Kumar M.S., Wamhoff B.R. Molecular regulation of vascular smooth muscle cell differentiation in development and disease. Physiol. Rev. 2004;84:767–801. doi: 10.1152/physrev.00041.2003. - DOI - PubMed
    1. Rensen S.S., Doevendans P.A., van Eys G.J. Regulation and characteristics of vascular smooth muscle cell phenotypic diversity. Neth. Heart J. 2007;15:100–108. - PMC - PubMed
    1. Doran A.C., Meller N., McNamara C.A. Role of smooth muscle cells in the initiation and early progression of atherosclerosis. Arterioscler. Thromb. Vasc. Biol. 2008;28:812–819. doi: 10.1161/ATVBAHA.107.159327. - DOI - PMC - PubMed
    1. Ross R. Cell biology of atherosclerosis. Annu. Rev. Physiol. 1995;57:791–804. doi: 10.1146/annurev.ph.57.030195.004043. - DOI - PubMed
    1. Bartel D.P. MicroRNAs: genomics, biogenesis, mechanism, and function. Cell. 2004;116:281–297. doi: 10.1016/S0092-8674(04)00045-5. - DOI - PubMed

Publication types

MeSH terms