. 2009 Nov 22;276(1675):3937-43.
doi: 10.1098/rspb.2009.1059. Epub 2009 Aug 19.

Evolution and emergence of novel human infections

Affiliations

Evolution and emergence of novel human infections

N Arinaminpathy et al. Proc Biol Sci. .

Abstract

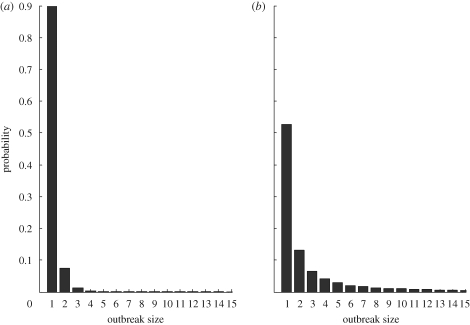
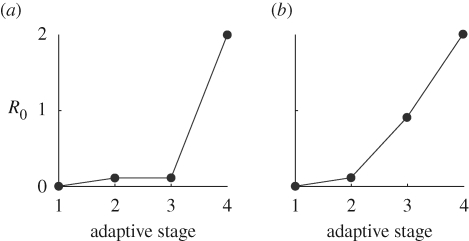
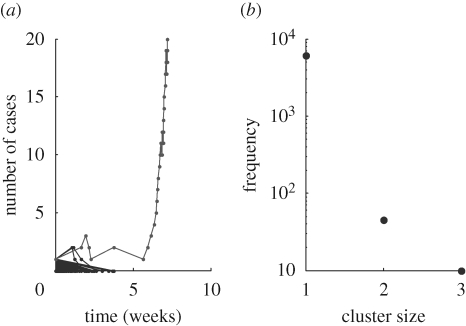
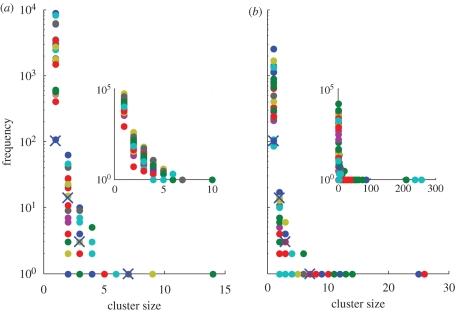
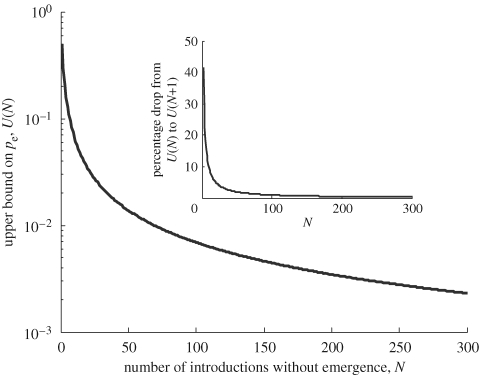
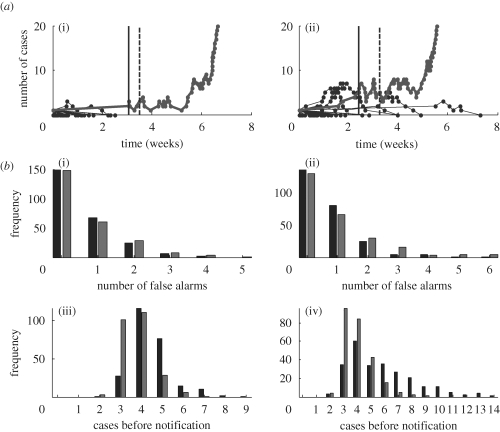
Some zoonotic pathogens cause sporadic infection in humans but rarely propagate further, while others have succeeded in overcoming the species barrier and becoming established in the human population. Adaptation, driven by selection pressure in human hosts, can play a significant role in allowing pathogens to cross this species barrier. Here we use a simple mathematical model to study potential epidemiological markers of adaptation. We ask: under what circumstances could ongoing adaptation be signalled by large clusters of human infection? If a pathogen has caused hundreds of cases but with little transmission, does this indicate that the species barrier cannot be crossed? Finally, how can case reports be monitored to detect an imminent emergence event? We distinguish evolutionary scenarios under which adaptation is likely to be signalled by large clusters of infection and under which emergence is likely to occur without any prior warning. Moreover, we show that a lack of transmission never rules out adaptability, regardless of how many zoonoses have occurred. Indeed, after the first 100 zoonotic cases, continuing sporadic zoonotic infections without onward, human-to-human transmission offer little extra information on pathogen adaptability. Finally, we present a simple method for monitoring outbreaks for signs of emergence and discuss public health implications.


Figures

Figure 1.
Figure 1.
Outbreak size distributions for fixed R0. (a) R0 = 0.1 and (b) R0 = 0.9. These distributions have mean 1/(1 − R0).
Figure 2.
Figure 2.
Schematic of (a) punctuated and (b) gradual scenarios. Parameter values are presented in table 1.
Figure 3.
Figure 3.
Illustrations of results of the model, punctuated scenario. (a) Time series for a series of introductions (black) leading to emergence (grey). All introductions are initiated at time zero. (b) Distribution of cluster sizes arising from this calculation.
Figure 4.
Figure 4.
Cluster size distributions for the (a) punctuated and (b) gradual scenarios. Shown are distributions for 25 independent realizations of the process leading to emergence, with each distribution distinguished by a different colour. Insets show distributions where the penultimate mutation rate has been reduced 10-fold to a value of 0.01. Crosses show H5N1 data from Indonesia.
Figure 5.
Figure 5.
Upper bound on the probability of emergence per introduction pe, given that n introductions have occurred without emergence (U(N)). Calculated as the maximal value of pe giving at least a 50 per cent probability of observing N introductions without emergence. Although giving infinitesimally small values for pe for large N, the curve does not reach pe = 0 for any finite N. Inset shows the ‘relative information gain’ acquired as N increases, measured as the percentage drop from U(N) to U(N+1). Again, this quantity has almost entirely diminished by the time N = 100.
Figure 6.
Figure 6.
Early warning systems for detecting pandemic emergence. The ‘single’ method monitors outbreak size, raising an alarm if a threshold with respect to past outbreak sizes is exceeded. The ‘double’ method additionally monitors daily incidence (see text for details). (a) Sample time courses of infection leading to emergence. Vertical, dashed line: time of notification with the single approach. Vertical, solid line: time of notification with the double approach. (i) punctuated scenario (ii) gradual scenario. (b) Graphs of algorithm performance, calculated over 250 simulated emergences, with the alarm silenced for the first 400 introductions. Black bars, single; grey bars, double. (i, ii) Specificity is measured by number of false alarms before an emergence, (iii, iv) while sensitivity is measured by the number of cases before an alarm occurs, in the event of a genuine emergence. Left- and right-hand panels refer to punctuated and gradual scenarios, respectively.

References

    1. Anderson R. M., May R. M.1991Infectious diseases of humans: dynamics and control Oxford: Oxford University Press
    1. André J. B., Day T.2005The effect of disease life history on the evolutionary emergence of novel pathogens. Proc. R. Soc. B 272, 1949–1956 (doi:10.1098/rspb.2005.3170) - DOI - PMC - PubMed
    1. Antia R., Regoes R., Koella J., Bergstrom C.2003The role of evolution in the emergence of infectious diseases. Nature 426, 658–661 (doi:10.1038/nature02104) - DOI - PMC - PubMed
    1. Athreya K., Ney P.1972Branching processes Berlin, Germany: Springer
    1. Becker N.1974On parametric estimation for mortal branching processes. Biometrika 61, 393–399

Publication types

MeSH terms