Comparative Study
. 2009 Aug 19;29(33):10287-98.
doi: 10.1523/JNEUROSCI.0505-09.2009.

The way an odor is experienced during aversive conditioning determines the extent of the network recruited during retrieval: a multisite electrophysiological study in rats

Affiliations
Comparative Study

The way an odor is experienced during aversive conditioning determines the extent of the network recruited during retrieval: a multisite electrophysiological study in rats

Julie Chapuis et al. J Neurosci. .

Abstract

Recent findings have revealed the importance of orthonasal and retronasal olfaction in food memory, especially in conditioned odor aversion (COA); however, little is known about the dynamics of the cerebral circuit involved in the recognition of an odor as a toxic food signal and whether the activated network depends on the way (orthonasal vs retronasal) the odor was first experienced. In this study, we mapped the modulations of odor-induced oscillatory activities through COA learning using multisite recordings of local field potentials in behaving rats. During conditioning, orthonasal odor alone or associated with ingested odor was paired with immediate illness. For all animals, COA retrieval was assessed by orthonasal smelling only. Both types of conditioning induced similarly strong COA. Results pointed out (1) a predictive correlation between the emergence of powerful beta (15-40 Hz) activity and the behavioral expression of COA and (2) a differential network distribution of this beta activity according to the way the animals were exposed to the odor during conditioning. Indeed, for both types of conditioning, the aversive behavior was predicted by the emergence of a strong beta oscillatory activity in response to the odor in the olfactory bulb, piriform cortex, orbitofrontal cortex, and basolateral amygdala. This network was selectively extended to the infralimbic and insular cortices when the odor was ingested during acquisition. These differential networks could participate in different food odor memory; these results are discussed in line with recent behavioral results that indicate that COA can be formed over long odor-illness delays only if the odor is ingested.


Figures
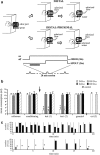
Figure 1.
Figure 1.
Behavioral data. a, Each trial was initiated by the detection of a nose poke in the port, which triggered olfactory stimulation (30 s in total). After a delay of 4 s after odor onset, the drinking spout (containing pure water for the distal condition or odorized water for the distal–proximal condition) was made available until odor offset. During this 4 s delay, video analysis allowed us to determine the real duration of odor sampling (black bar), i.e., the minimal time spent at the vicinity of the odor port. b, Mean (+SEM) liquid consumption for each experimental session and each group (see Table 1 for details on conditions of olfactory stimulation). An asterisk indicates a significant decrease of consumption between conditioning and test sessions (paired t test; p < 0.01, at least). The D-D-a and DP-D-a groups (“aversive groups”) developed a strong odor aversion, contrary to the DP-D-n and D-D-n groups (“nonaversive groups”) and to the control group. c, Examples of licking patterns during conditioning (top) and test (down) sessions for a DP-D-a rat. Each trial (thin bars) could be followed by drink intake or no intake, expressed in terms of number of licks (black histograms). Asterisks indicate trials with very weak or no water intake.
Figure 2.
Figure 2.
Schematic representation of localization of the eight recording sites [adapted from Paxinos and Watson (1998)]. Numbers on the left of the slices indicate the anteroposterior distance relative to the bregma suture. The shaded zone summarizes the extension of recorded sites obtained from all rats (OFC, most dorsal shaded zone of the slice; aPC, most ventral shaded zone; BLA, most dorsal shaded zone; pPC, more ventral shaded zone).
Figure 3.
Figure 3.
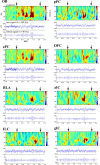
Representative local field potentials preceding and during odor sampling for the eight recording sites in parallel. The example shown represents a trial of a DP-D-a rat during test (1) for which odor sampling was followed by an absence of drink intake. For each site, we present the raw signal (middle trace), the signal filtered in the beta frequency band (bottom trace), and the corresponding time–frequency decomposition between 15 and 40 Hz (scalogram, top of each figure). To visually compare beta power values across structures, normalization by the mean power of the baseline period was applied to the scalograms. Odor onset (time 0) is indicated by the dashed line. In each recording site, the odor sampling period (time between the vertical arrows) is associated with a transient increased amplitude in beta band activity.
Figure 4.
Figure 4.
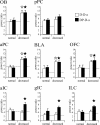
Modulation of beta oscillatory activity through odor aversion learning in the eight recording sites. Results concerned animals of the D-D-a (in white) and DP-D-a (in black) groups, which developed a strong odor aversion after CS–US pairing (Fig. 1 b). On each graph, the y-axis represents the average (+SEM) values of the ratio of amplitude of the beta response during odor sampling on the power relative to the preceding baseline period value. The x-axis represents the experimental session. Since no extinction of odor aversion was measured between tests 1 and 2 (Fig. 1 b), trials of the two sessions were pooled. Data of the reference session represent beta-band basal activity in the absence of olfactory stimulation. For each group, an asterisk indicates an increase in power ratio compared with the reference session (Mann–Whitney U test; p < 0.03, at least). Significant differences between conditioning and test sessions for each group are elucidated by vertical bars (Mann–Whitney U test; p < 0.01, at least). A star indicates a significant difference between the two groups for a given condition (Mann–Whitney U test; p < 0.01, at least). A triangle indicates for each group a significant increase in power between the first presentation of Iso (during conditioning) and Ger odor (Mann–Whitney U test; p < 0.05). The extinction histograms correspond to the data collected when all the animals of both groups recovered the consumption measured during the conditioning period, i.e., preceding the CS–US pairing (Fig. 1 b).
Figure 5.
Figure 5.
Changes in beta power are predictive of the strength of aversive behavior. Mean (+SEM) power ratio in the beta frequency band during the test sessions of the D-D and DP-D aversive groups. Here, trials were separated according to the type of drink intake (normal or decreased) (Fig. 1 c). A star indicates a significant difference between the two categories of trials for the D-D-a (in white) and DP-D-a (in black) groups (Mann–Whitney U test, p < 0.05, at least). The dashed line reports the mean level of energy during the conditioning session.
Figure 6.
Figure 6.
Beta oscillatory activity is not amplified in absence of odor aversion learning. Mean (+SEM) power ratio in the beta frequency band. Results presented in a concern animals of the D-D-n (in white) and DP-D-n (in black) groups, which had received a CS–US pairing but had developed no odor aversion (Fig. 1 b). Results presented in b concern control animals, which received an injection of physiological saline. An asterisk indicates a significant increase of power ratio between the reference session (in white) and the first (in gray) and the second (in black) Iso presentation (Mann–Whitney U test; p < 0.05 at least).
Figure 7.
Figure 7.
Mean (+SEM) power ratio in the beta frequency band during the test sessions of the D-D and DP-D nonaversive (a) and control (b) groups. As for the aversive groups (Fig. 5), trials were separated according to the type of drink intake (normal or decreased). The dashed line reports the mean level of energy during the conditioning session. No significant difference of beta power was found between the two types of trials for any group (Mann–Whitney U test; p > 0.05).

References

    1. Akirav I, Khatsrinov V, Vouimba RM, Merhav M, Ferreira G, Rosenblum K, Maroun M. Extinction of conditioned taste aversion depends on functional protein synthesis but not on NMDA receptor activation in the ventromedial prefrontal cortex. Learn Mem. 2006;13:254–258. - PMC - PubMed
    1. Bermúdez-Rattoni F. Molecular mechanisms of taste-recognition memory. Nat Rev Neurosci. 2004;5:209–217. - PubMed
    1. Bermúdez-Rattoni F, Grijalva CV, Kiefer SW, Garcia J. Flavor-illness aversions: the role of the amygdala in the acquisition of taste-potentiated odor aversions. Physiol Behav. 1986;38:503–508. - PubMed
    1. Beshel J, Kopell N, Kay LM. Olfactory bulb gamma oscillations are enhanced with task demands. J Neurosci. 2007;27:8358–8365. - PMC - PubMed
    1. Boix-Trelis N, Vale-Martínez A, Guillazo-Blanch G, Martí-Nicolovius M. Muscarinic cholinergic receptor blockade in the rat prelimbic cortex impairs the social transmission of food preference. Neurobiol Learn Mem. 2007;87:659–668. - PubMed

Publication types

LinkOut - more resources