Comparative Study
. 2009 Aug 19;29(33):10387-95.
doi: 10.1523/JNEUROSCI.1978-09.2009.

Serotonergic modulation of locomotion in zebrafish: endogenous release and synaptic mechanisms

Affiliations
Comparative Study

Serotonergic modulation of locomotion in zebrafish: endogenous release and synaptic mechanisms

Jens Peter Gabriel et al. J Neurosci. .

Abstract

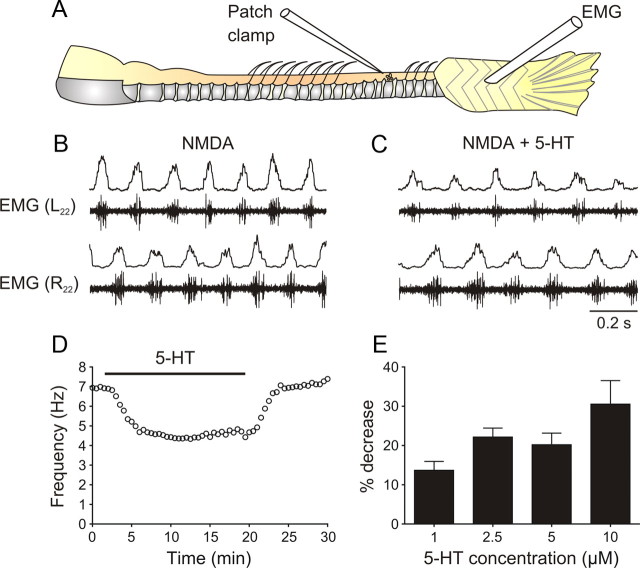
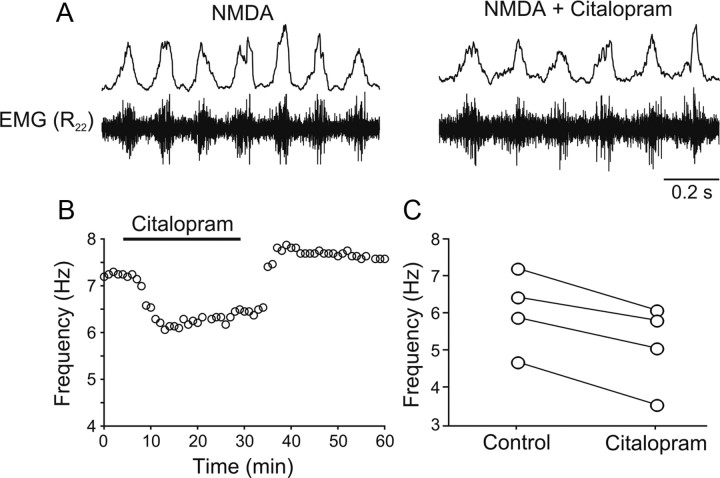
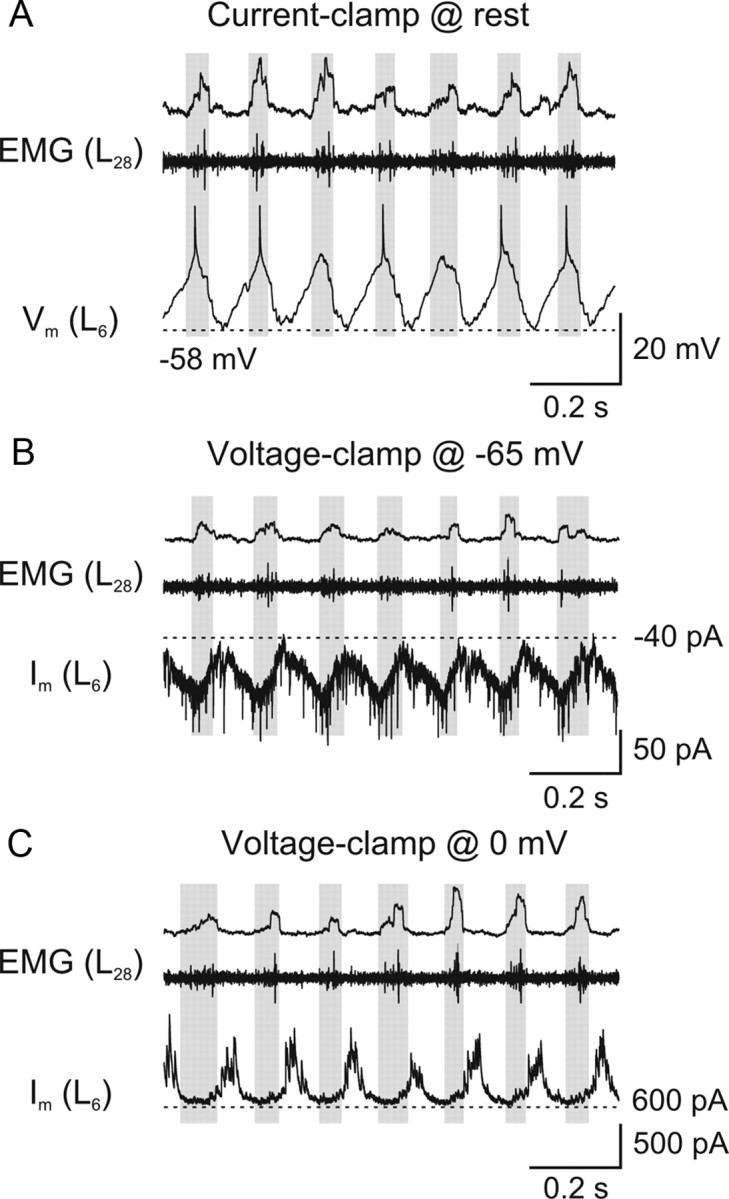
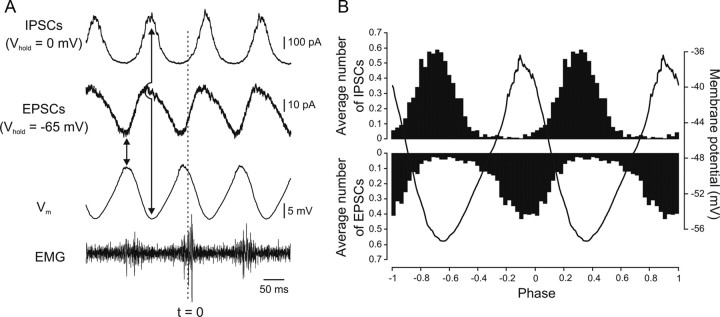
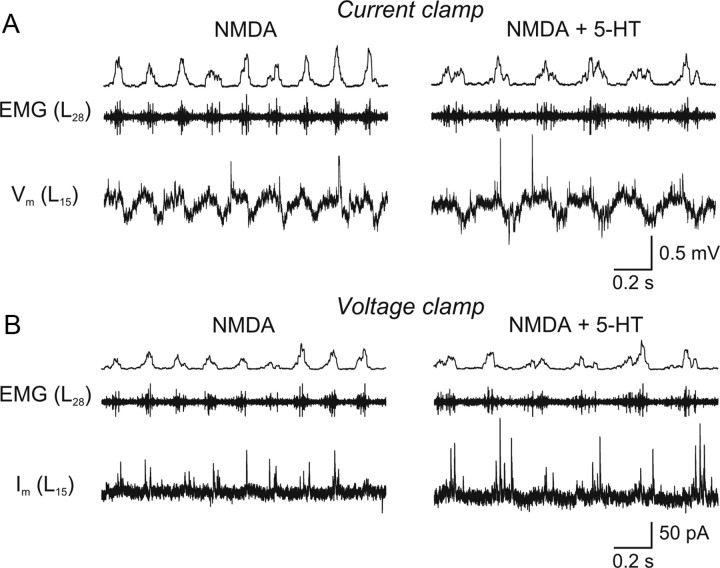
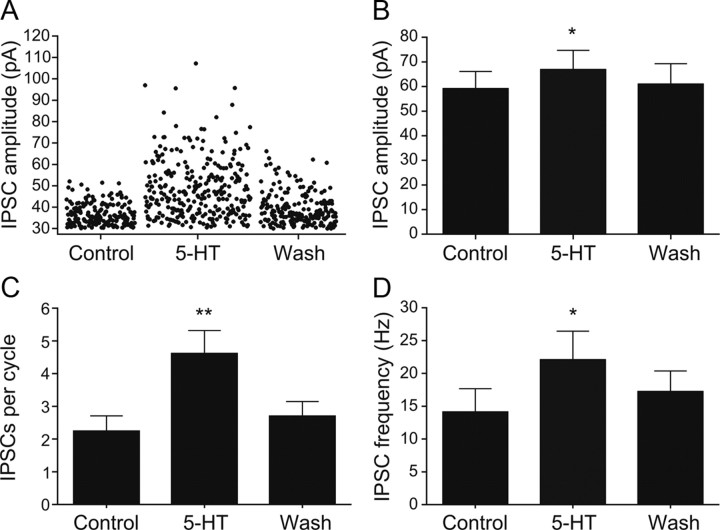
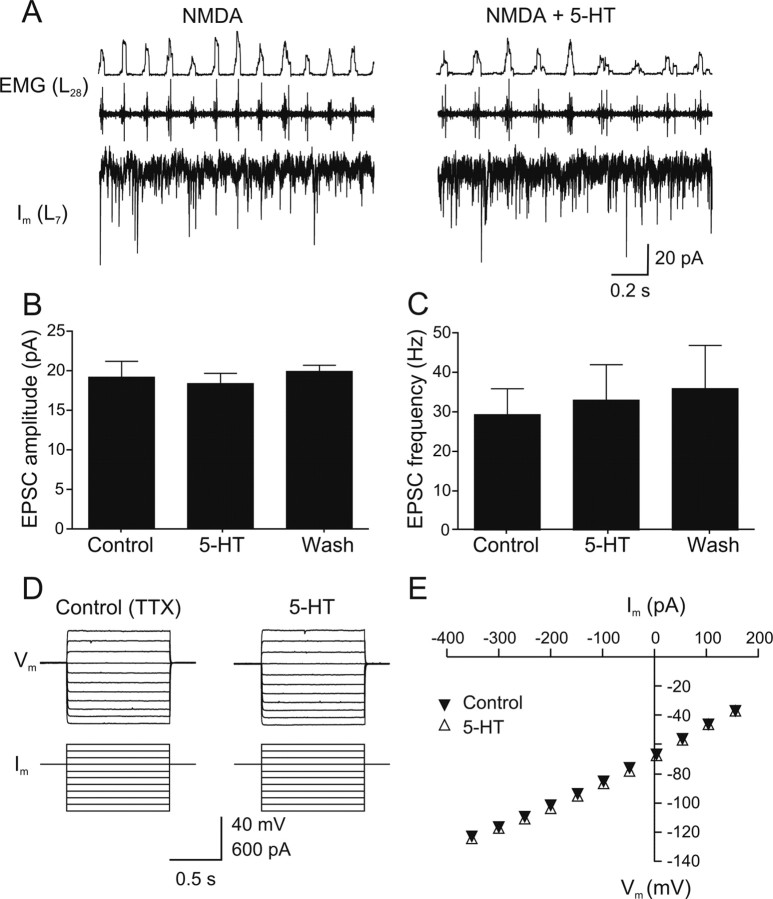
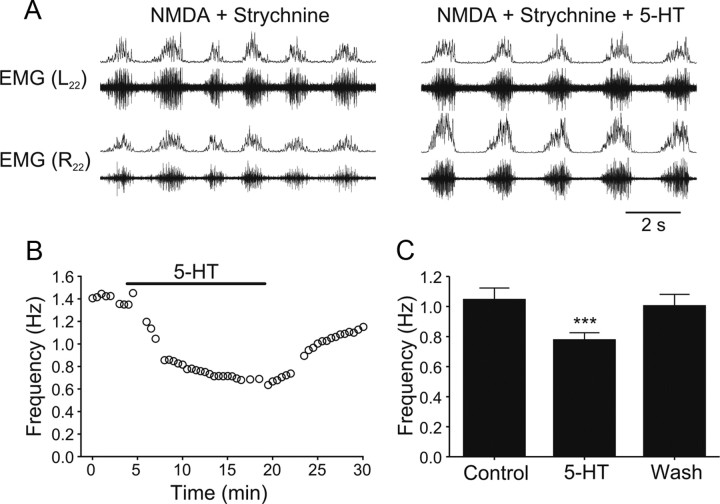
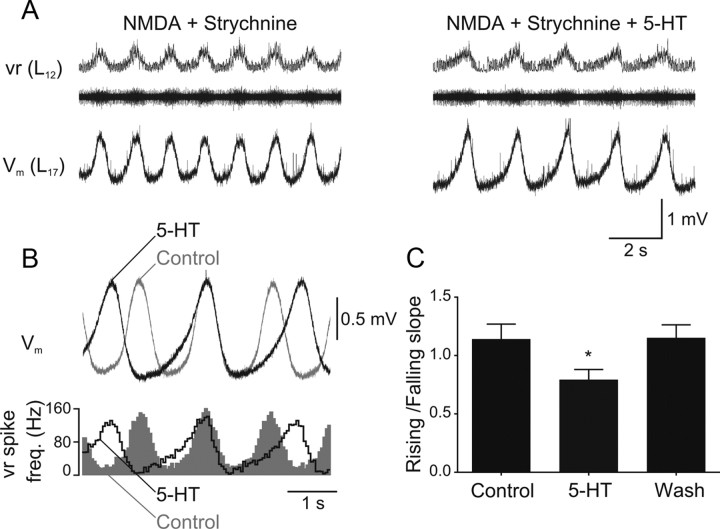
Serotonin (5-HT) plays an important role in shaping the activity of the spinal networks underlying locomotion in many vertebrate preparations. At larval stages in zebrafish, 5-HT does not change the frequency of spontaneous swimming; and it only decreases the quiescent period between consecutive swimming episodes. However, it is not known whether 5-HT exerts similar actions on the locomotor network at later developmental stages. For this, the effect of 5-HT on the fictive locomotor pattern of juvenile and adult zebrafish was analyzed. Bath-application of 5-HT (1-20 mum) reduced the frequency of the NMDA-induced locomotor rhythm. Blocking removal from the synaptic cleft with the reuptake inhibitor citalopram had similar effects, suggesting that endogenous serotonin is modulating the locomotor pattern. One target for this modulation was the mid-cycle inhibition during locomotion because the IPSPs recorded in spinal neurons during the hyperpolarized phase were increased both in amplitude and occurrence by 5-HT. Similar results were obtained for IPSCs recorded in spinal neurons clamped at the reversal potential of excitatory currents (0 mV). 5-HT also slows down the rising phase of the excitatory drive recorded in spinal cord neurons when glycinergic inhibition is blocked. These results suggest that the decrease in the locomotor burst frequency induced by 5-HT is mediated by a potentiation of mid-cycle inhibition combined with a delayed onset of the subsequent depolarization.


Figures

Figure 1.
Figure 1.
5-HT decreases the locomotor cycle frequency. A, Schematic drawing of the preparation. B, Locomotor pattern is generated in the in vitro hindbrain/spinal cord preparation by perfusion of NMDA (40 μm). Throughout the figures, the raw EMG trace is shown together with the smoothed rectified trace. C, When 5-HT (5 μm) is added, the locomotor frequency decreases. D, Time course of the decrease in the locomotor frequency (fictive locomotion induced by 40 μm NMDA) in 5-HT (10 μm). E, Decrease in the locomotor frequency at different 5-HT concentrations. Addition of 1 μm 5-HT decreased the locomotor frequency induced by 30–50 μm NMDA by 13.7% (n = 12). The decrease in 2.5, 5, and 10 μm 5-HT was 22.1% (n = 11), 20.2% (n = 14) and 30.5% (n = 2), respectively.
Figure 2.
Figure 2.
Endogenous release of 5-HT during locomotion. A, The frequency of the locomotor rhythm decreases by application of the selective serotonin reuptake inhibitor citalopram (1–5 μm). B, Time course of the decrease in the locomotor frequency (fictive locomotion induced by 40 μm NMDA) by citalopram (5 μm). C, Quantification of the decrease of the locomotor frequency (fictive locomotion induced by 40 μm NMDA) in citalopram (1–5 μm) (p < 0.05; n = 4).
Figure 3.
Figure 3.
Phasic excitatory and inhibitory synaptic inputs during locomotion. A, Intracellular recording from a spinal neuron which displays membrane potential oscillations during fictive locomotion induced by NMDA (40 μm). This neuron depolarizes in phase with the ipsilateral, more caudal EMG recording (gray boxes). B, When the neuron is clamped at the reversal potential of inhibitory currents (−65 mV), EPSCs are visible and occur in phase with the ipsilateral EMG activity. C, When the neuron is clamped at the reversal potential of excitatory currents (0 mV), IPSCs are visible and occur in antiphase with the EMG activity.
Figure 4.
Figure 4.
Alternating excitatory and inhibitory currents underlying the phasic oscillations during locomotion. A, Waveform average (50 swimming cycles each) of an intracellular recording from a spinal neuron during NMDA-induced fictive locomotion in current-clamp (Vm, no bias current was injected) and voltage-clamp (Vhold = 0 mV and −65 mV). The peak of the integrated ipsilateral EMG recording is taken as a reference (t = 0). B, Histogram showing the distribution of the average number of unitary EPSCs and IPSCs received by the neuron during different phases of the locomotor cycle. The values correspond to the average number of PSCs per bin (binwidth 1/36th of a cycle corresponding to 10 degrees of phase) for 225 cycles for the IPSCs and 315 cycles for the EPSCs. The peak of the integrated ipsilateral EMG recording is used as a reference and the membrane potential oscillation is shown for comparison.
Figure 5.
Figure 5.
5-HT increases the amplitude of mid-cycle inhibition during locomotion. A, Intracellular recording of a spinal neuron during fictive locomotion induced by NMDA (40 μm) that shows membrane potential oscillations. Please note the occurrence of IPSPs during the hyperpolarized phase of the oscillations. In 5-HT (20 μm), the locomotor frequency decreases and the IPSPs increase in amplitude and number. B, Rhythmic IPSCs recorded in the same spinal neuron voltage-clamped at a holding potential of 0 mV that increase in amplitude and number in 5-HT (20 μm).
Figure 6.
Figure 6.
5-HT increases the amplitude and frequency of IPSCs underlying mid-cycle inhibition. A, Amplitude of IPSCs recorded in a spinal cord neuron during locomotion in control (40 μm NMDA, n = 190 events), 5-HT (10 μm in 40 μm NMDA, n = 293 events), and during washout (40 μm NMDA, n = 210 events). B, The mean amplitude of the IPSCs increases from 36.3 ± 0.4 pA in control to 48.2 ± 0.8 pA in 5-HT (p < 0.0001; washout: 38.9 ± 0.5 pA). C, D, Quantification of the change in the IPSC number per cycle (p < 0.01; n = 8) and frequency (p < 0.05; n = 8) in control, 5-HT (10–20 μm), and wash.
Figure 7.
Figure 7.
5-HT does not affect the EPSCs underlying the phasic excitation or basic cellular properties. A, Rhythmic EPSCs recorded in a spinal neuron in voltage-clamp at a holding potential of −65 mV in control (40 μm NMDA) and in 5-HT (10 μm). B, C, 5-HT does not affect the EPSCs amplitude and frequency (p > 0.05; n = 6). D, Current pulses were injected in dorsal secondary motoneurons in the presence of TTX (0.5 μm). Application of 5-HT (10 μm) did not change the input resistance. E, The shape of the V–I curve measured in dorsal secondary motoneurons was unaffected by 5-HT.
Figure 8.
Figure 8.
5-HT-induced decrease of the frequency of the rhythm in the absence of inhibition. A, When glycinergic inhibition is blocked with strychnine (0.5 μm in 30–50 μm NMDA), the alternating motor pattern changes to a slow, synchronous rhythm. Application of 5-HT (5–10 μm) decreases the frequency of this rhythm. B, Time course of the decrease in the rhythm frequency induced by 5-HT (5 μm). C, Quantification of the decrease in the frequency by 5-HT (5 μm; p < 0.001; n = 12).
Figure 9.
Figure 9.
5-HT delays the onset of the excitatory synaptic drive. A, When glycinergic inhibition is blocked by strychnine (0.5 μm), NMDA (50 μm) induces slow membrane potential oscillations in spinal neurons that occur in phase with the ipsilateral ventral root burst. Application of 5-HT (10 μm) decreases the burst frequency and slows down the depolarizing phase of the excitatory drive. B, Waveform average of 25 cycles in control and in 5-HT from the same recording as in A. The bottom trace shows the average spike frequency of the ipsilateral ventral root in control (gray area) and in 5-HT (black outline). C, The slope of the linear fit to the depolarizing and the repolarizing phase (30–70% amplitude) was calculated. The ratio of these slopes decreases in 5-HT (5–10 μm), indicating that the depolarization is slowed down with respect to the repolarization phase (p < 0.05, n = 12).

References

    1. Beato M, Nistri A. Serotonin-induced inhibition of locomotor rhythm of the rat isolated spinal cord is mediated by the 5-HT1 receptor class. Proc Biol Sci. 1998;265:2073–2080. - PMC - PubMed
    1. Berg RW, Alaburda A, Hounsgaard J. Balanced inhibition and excitation drive spike activity in spinal half-centers. Science. 2007;315:390–393. - PubMed
    1. Biró Z, Hill RH, Grillner S. 5-HT Modulation of identified segmental premotor interneurons in the lamprey spinal cord. J Neurophysiol. 2006;96:931–935. - PubMed
    1. Bracci E, Beato M, Nistri A. Extracellular K+ induces locomotor-like patterns in the rat spinal cord in vitro: comparison with NMDA or 5-HT induced activity. J Neurophysiol. 1998;79:2643–2652. - PubMed
    1. Brustein E, Drapeau P. Serotoninergic modulation of chloride homeostasis during maturation of the locomotor network in zebrafish. J Neurosci. 2005;25:10607–10616. - PMC - PubMed

Publication types

LinkOut - more resources