

Evaluation of the eclipse electron Monte Carlo dose calculation for small fields
- PMID: 19692969
- PMCID: PMC5720559
- DOI: 10.1120/jacmp.v10i3.2834
Evaluation of the eclipse electron Monte Carlo dose calculation for small fields
Abstract
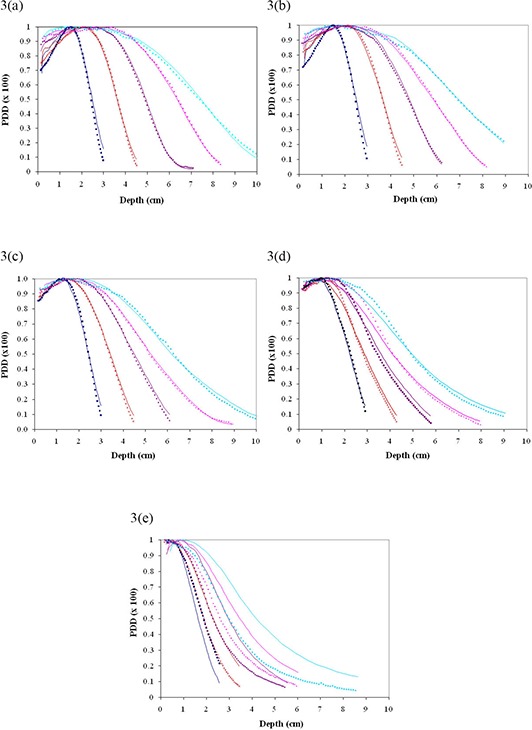
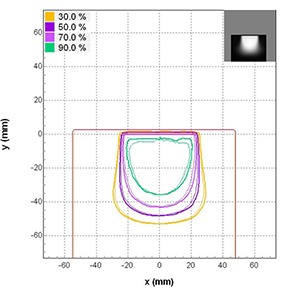
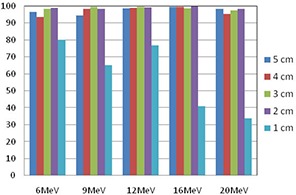
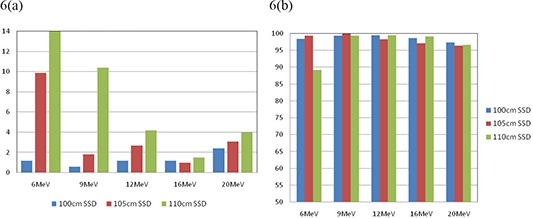
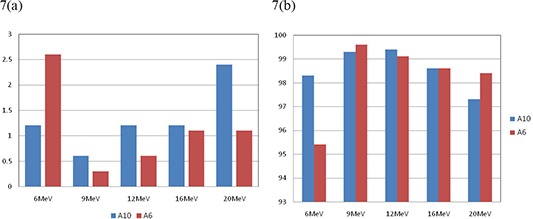
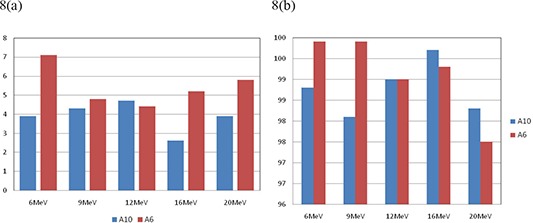
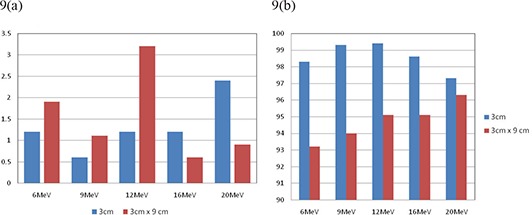
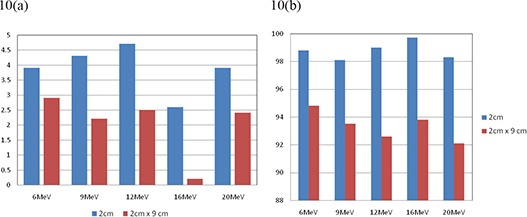
Varian Medical Systems (Palo Alto, CA) has implemented the Monte Carlo electron dose calculation algorithm (eMC) in the Eclipse treatment planning system. Previous algorithms for electron treatment planning were limited in their calculation ability for small field depth doses and monitor units. An old rule of thumb to approximate the limiting cutout size for an electron field was determined by the lateral scatter equilibrium and approximated by E (MeV)/2.5 in centimeters of water. In this study we compared eMC calculations and measurements of depth doses, isodose distributions and monitor units for several different energy and small field cutout size combinations at different SSDs. Measurements were made using EBT film (International Specialty Products, Wayne, NJ) and a PinPoint Ion Chamber (PTW, Hicksville, NY). Our results indicate that the eMC algorithm can accurately predict depth doses, isodose distributions and monitor units (within 2.5%) for field sizes as small as 3.0 cm diameter for energies in the 6 to 20 MeV range at 100 cm SSD. Therefore, the previous energy dependent rule of thumb does not apply to the Eclipse electron Monte Carlo code. However, at extended SSDs (105-110 cm), the results show good agreement (within 4 %) only for higher energies (12, 16, and 20 MeV) for a field size of 3 cm.
Figures
References
-
- Sternick E. Algorithms for computerized treatment planning. In: Orton CG, Baagne F, editors. Practical aspects of electron beam treatment planning: Proceedings of the Practical Aspects of Electron Beam Treatment Planning Symposium; 1977 July 31; Cincinnati, Ohio. New York: American Institute of Physics; 1978. p. 52.
-
- Hogstrom KR, Starkschall G, Shiu AS. Dose calculation algorithms for electron beams. In: Purdy JA, editor. Advances in radiation oncology physics: Dosimetry, Treatment Planning and Brachytherapy. American Institute of Physics Monograph 19. New York: American Institute of Physics; 1992. p. 900.
-
- Lax I, Brahme A. Collimation of high energy electron beams. Acta Radiol Oncol. 1980;19(3):199–207. - PubMed
-
- Ding GX, Duggan DM, Coffey CW, Shokrani P, Cygler JE. First macro Monte Carlo based commercial dose calculation module for electron beam treatment planning – new issues for clinical consideration. Phys Med Biol. 2006;51(11):2781–99. - PubMed
-
- Neuenschwander H, Mackie TR, Reckwerdt PJ. MMC‐a high‐performance Monte Carlo code for electron beam treatment planning. Phys Med Biol. 1995;40(4):543–74. - PubMed
MeSH terms
LinkOut - more resources
Full Text Sources
