. 2009 Sep 3;461(7260):99-103.
doi: 10.1038/nature08242. Epub 2009 Aug 19.

Coordination of Rho GTPase activities during cell protrusion

Affiliations

Coordination of Rho GTPase activities during cell protrusion

Matthias Machacek et al. Nature. .

Abstract

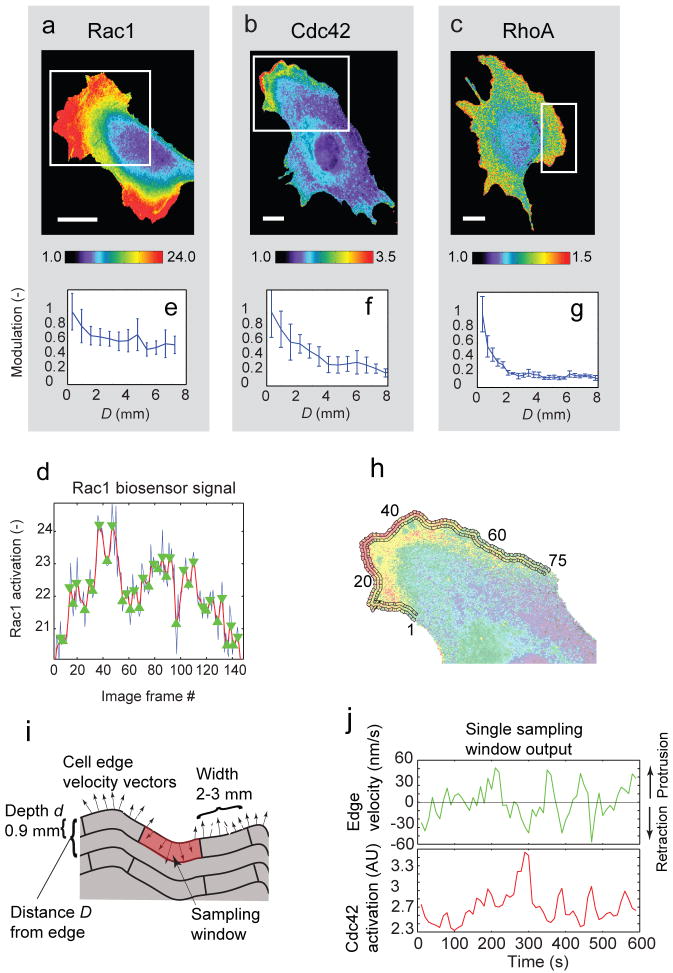
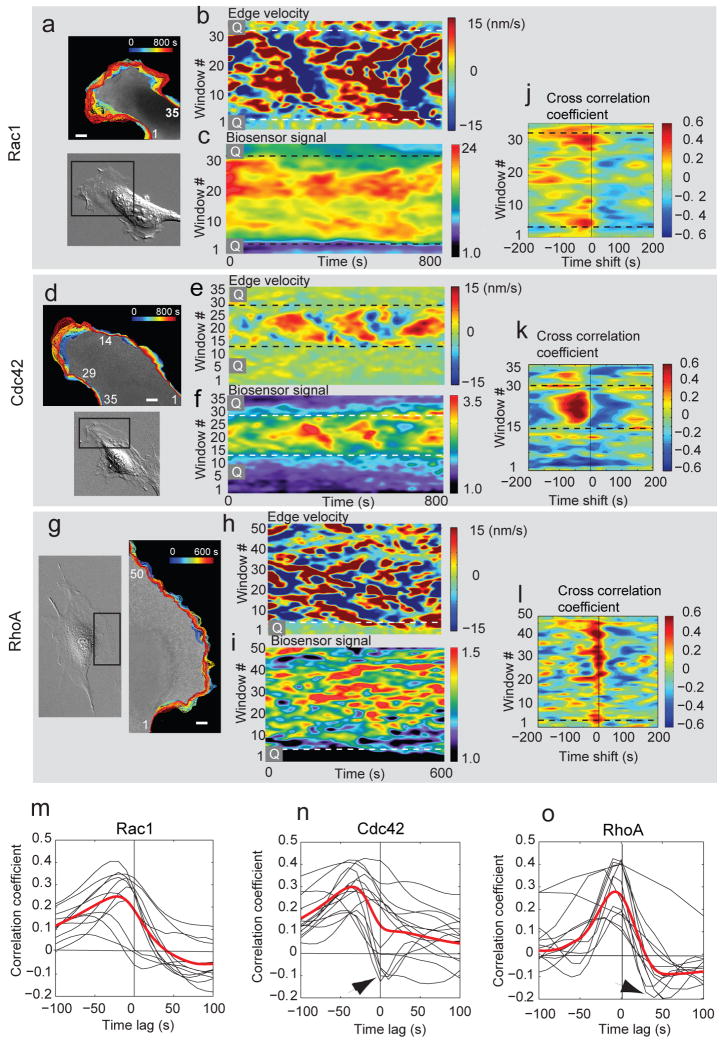
The GTPases Rac1, RhoA and Cdc42 act together to control cytoskeleton dynamics. Recent biosensor studies have shown that all three GTPases are activated at the front of migrating cells, and biochemical evidence suggests that they may regulate one another: Cdc42 can activate Rac1 (ref. 8), and Rac1 and RhoA are mutually inhibitory. However, their spatiotemporal coordination, at the seconds and single-micrometre dimensions typical of individual protrusion events, remains unknown. Here we examine GTPase coordination in mouse embryonic fibroblasts both through simultaneous visualization of two GTPase biosensors and using a 'computational multiplexing' approach capable of defining the relationships between multiple protein activities visualized in separate experiments. We found that RhoA is activated at the cell edge synchronous with edge advancement, whereas Cdc42 and Rac1 are activated 2 micro-m behind the edge with a delay of 40 s. This indicates that Rac1 and RhoA operate antagonistically through spatial separation and precise timing, and that RhoA has a role in the initial events of protrusion, whereas Rac1 and Cdc42 activate pathways implicated in reinforcement and stabilization of newly expanded protrusions.


Figures

Figure 1
Figure 1. Activation of Rho GTPases in migrating mouse embryonic fibroblasts
(a) Rac1, (b) Cdc42, and (c) RhoA activation reported by biosensors. White rectangle: Region of interest selected for analysis. Scale bar: 20 μm. (d) Time course (blue line) of Rac1 activation within 0.6 μm from the cell edge, averaged over a 5 μm long portion of the cell edge. Red line: filtered time-course (Gaussian filter, σ=5 frames). Green triangles: local maxima and minima of filtered time-course. (e-g) Modulation of GTPase activation (mean absolute difference between consecutive local extrema of the time-course) as a function of the distance D from the leading edge. Values are normalized to the modulation at the cell edge. Error bars: s.e.m. of n = 6 (Rac1); n = 4 (Cdc42); n = 4 (RhoA) cells. (h) Sampling windows of 0.9 μm depth placed at the cell edge and at D = 1.8 μm from the cell edge. (i) Parameters to define the position and size of a sampling window. In each window, the time course of GTPase activation was recorded (average of ∼10 pixels). For a sampling window at D = 0, a time course of edge velocity was recorded (mean of 6 – 8 measurements). (j) Time courses of edge velocity (green) and GTPase activation (Cdc42, red) recorded in one sampling window.
Figure 2
Figure 2. Dynamics of cell edge morphology and GTPase activation
(a, d, g) Overview of cell morphology (in DIC) and evolution of cell edge positions (color-encoded from blue (early) to red (late) time points). Scale bar: 5 μm. (b, e, h) Activity maps of edge movement: Velocity values along the edge are copied time point by time point into the columns of the map. Color coding: red = protrusion; blue = retraction. Quiescent regions of the cell edge are marked by ‘Q’. (c, f, i) Activity maps of Rho GTPase activation: Colors designate the activation level of the Rho GTPase recorded in a sampling window at D = 0 μm. (j, k, l) Cross-correlation coefficients (color-coded) between edge velocity and Rac1 (j), Cdc42 (k) and RhoA (l) as a function of the sampling window and time shift. (m, n, o) Temporal cross-correlation functions for individual cells (black). Red: Average cross-correlation functions per GTPase resulting from a spline fit to the combined single cell cross-correlation functions; n = 11 cells (Rac1); n = 12 cells (Cdc42); n = 12 cells (RhoA). Arrowheads: some cells show negative correlation coefficients at positive time lags, likely associated with ruffling (see text).
Figure 3
Figure 3. Correlation of Rho GTPase activation and cell edge velocity as a function of time and space
(a-c) Cross-correlation functions between edge velocity and GTPase activation at D = 0 (red line), 0.6, 1.3, 2.5, 4.4 and 6.3 μm. Dashed line: 95% confidence level for correlation values. (d-f) Blue line: magnitude of cross-correlation maximum as a function of D (blue bracket in b). Red line: time lag of cross-correlation maxima as a function of D (red bracket in b). Dashed lines: 95% confidence interval estimated by bootstrap sampling of residual distributions to the spline fits (see Supplementary Methods). Grey area: region with correlation values below 95% confidence. Of note, time lags of cross-correlation maxima in this area are no longer meaningful. Data derived from n = 6 (Rac1), n=5 (Cdc42) and n = 5 (RhoA) cells.
Figure 4
Figure 4. Spatiotemporal coordination of Rac1, Cdc42, and RhoA activation
(a) Timing of Rho GTPase activation relative to edge velocity, as determined by temporal cross-correlation functions. The variable ‘edge movement’ is being used as the reference signal. Thus, correlation maxima in the sector labeled “After” indicate that the GTPase reaches the activation maximum after the protrusion event (time point of fastest edge advancement). Dashed lines: 95% confidence intervals. Data originate from n = 11 cells (Rac1), n = 12 cells (Cdc42), and n=12 cells (RhoA). Confidence intervals were computed by bootstrap sampling of 2000 residuals to the spline fits. (b) Timing of RhoA activity relative to Cdc42 activity, both monitored in the same cell, as determined by the temporal cross-correlation function. The variable Cdc42 is being used as the reference signal. Thus, the correlation maximum in the sector labeled “Before” indicates that RhoA reaches the activation maximum before Cdc42 (n = 7 cells). (c) Model of GTPase activation during protrusion and retraction. Green: Rac1 activation. Black: RhoA activation. Blue: Cdc42 activation.

Comment in

References

    1. Jaffe AB, Hall A. Rho GTPases: Biochemistry and Biology. Annual Review of Cell and Developmental Biology. 2005;21:247–269. - PubMed
    1. Burridge K. Wennerberg, K., Rho and Rac Take Center Stage. Cell. 2004;116(2):167–179. - PubMed
    1. Ridley AJ, et al. Cell Migration: Integrating Signals from Front to Back. Science. 2003;302:1704–1709. - PubMed
    1. Kraynov V, et al. Localized Rac Activation Dynamics Visualized in Living Cells. Science. 2000;290:333–337. - PubMed
    1. Nalbant P, Hodgson L, Kraynov V, Toutchkine A, Hahn KM. Activation of Endogenous Cdc42 Visualized in Living Cells. Science. 2004;305:1615–1619. - PubMed

Publication types