. 2009 Aug 20;4(8):e6692.
doi: 10.1371/journal.pone.0006692.

Tumor invasion of Salmonella enterica serovar Typhimurium is accompanied by strong hemorrhage promoted by TNF-alpha

Affiliations

Tumor invasion of Salmonella enterica serovar Typhimurium is accompanied by strong hemorrhage promoted by TNF-alpha

Sara Leschner et al. PLoS One. .

Abstract

Background: Several facultative anaerobic bacteria with potential therapeutic abilities are known to preferentially colonize solid tumors after systemic administration. How they efficiently find and invade the tumors is still unclear. However, this is an important issue to be clarified when bacteria should be tailored for application in cancer therapy.

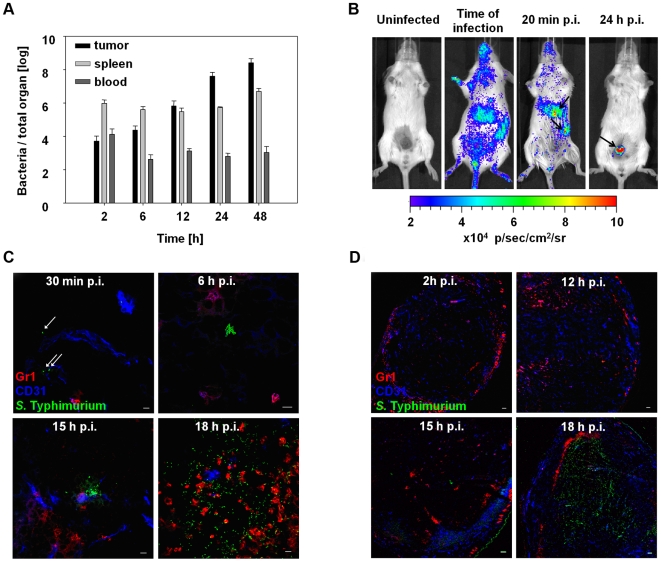
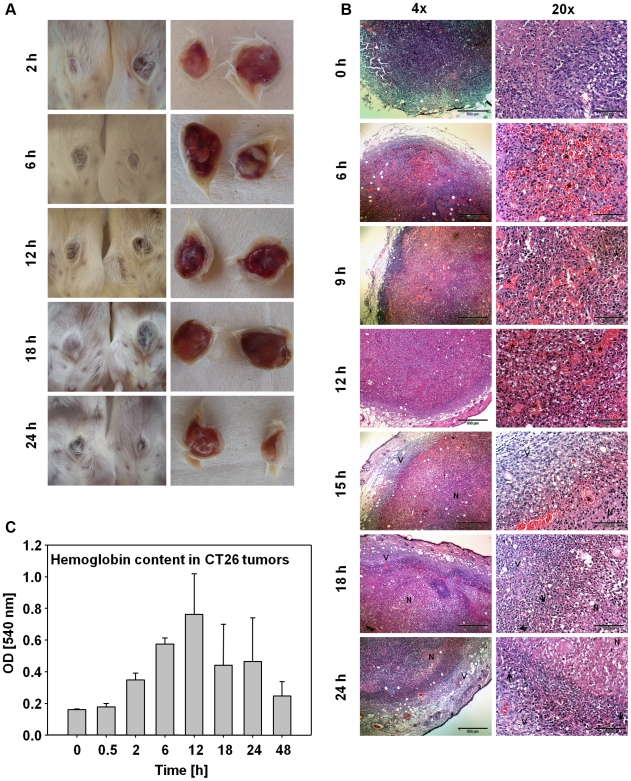
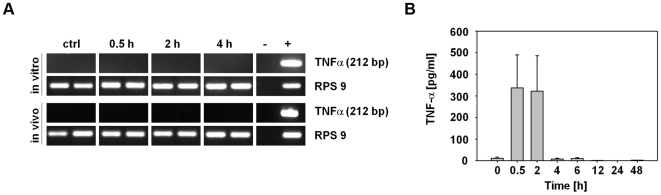
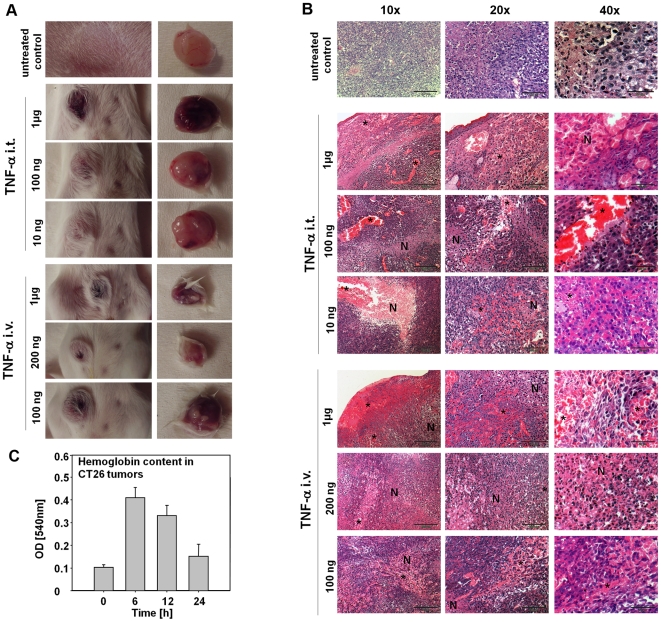
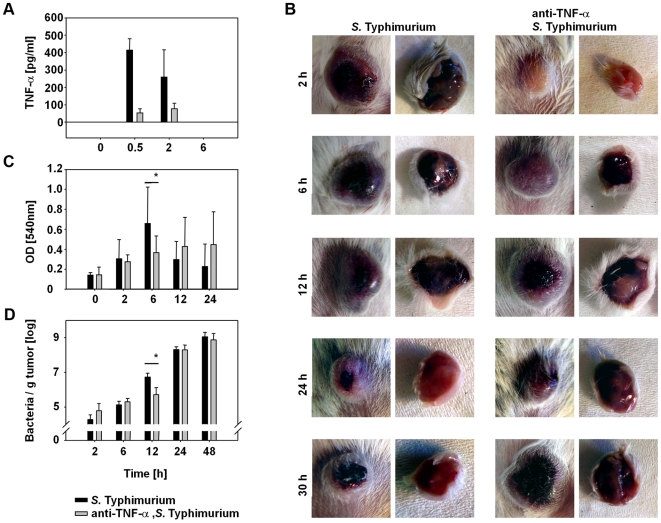
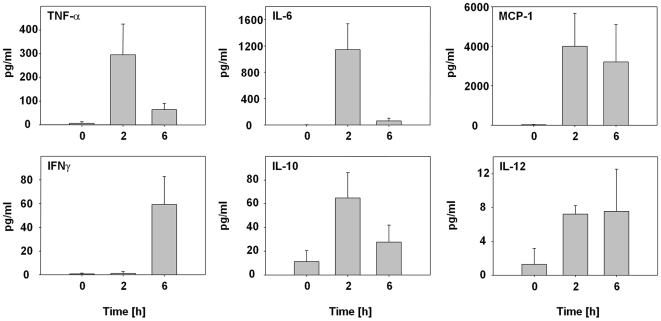
Methodology/principal findings: We describe the initial events of colonization of an ectopic transplantable tumor by Salmonella enterica serovar Typhimurium. Initially, after intravenous administration, bacteria were found in blood, spleen, and liver. Low numbers were also detected in tumors associated with blood vessels as could be observed by immunohistochemistry. A rapid increase of TNF-alpha in blood was observed at that time, in addition to other pro-inflammatory cytokines. This induced a tremendous influx of blood into the tumors by vascular disruption that could be visualized in H&E stainings and quantified by hemoglobin measurements of tumor homogenate. Most likely, together with the blood, bacteria were flushed into the tumor. In addition, blood influx was followed by necrosis formation, bacterial growth, and infiltration of neutrophilic granulocytes. Depletion of TNF-alpha retarded blood influx and delayed bacterial tumor-colonization.

Conclusion: Our findings emphasize similarities between Gram-negative tumor-colonizing bacteria and tumor vascular disrupting agents and show the involvement of TNF-alpha in the initial phase of tumor-colonization by bacteria.


Conflict of interest statement

Competing Interests: The authors have declared that no competing interests exist.

Figures

Figure 1
Figure 1. Time course of bacterial accumulation in different organs and bacterial colonization of solid CT26 tumors.
Tumor bearing mice were infected i.v. with S. Typhimurium SL7207. (a) 2 h, 6 h, 12 h, 24 h and 48 h p.i. tumor and spleen were homogenized. Tumor, spleen and blood were plated and the CFUs per total organ were determined. (b) Non-invasive in vivo imaging of bacterial bioluminescence. Tumor-bearing mice were infected with S. Typhimurium expressing the luxCDABE operon of Photorhabdus luminescens under the control of the β-Lactamase promoter. Arrows show sites of high bacterial accumulation. Images were taken at the indicated time points. (c) High magnification images of tumor cryosections at the indicated time points p.i. with S. Typhimurium SL7207. In all pictures, bacteria are stained in green, blood vessel endothelial cells are stained in blue and neutrophilic granulocytes are stained in red. White arrows point at individual Salmonella. White bars correspond to 10 µm in all pictures. (d) Overviews of CT26 tumor cryosections at the indicated time points p.i. with S. Typhimurium SL7207. Stainings are described in (c). White bars correspond to 100 µm in all pictures. Experiments were repeated at least three times with identical results.
Figure 2
Figure 2. Time course of blood influx into CT26 tumors after bacterial infection.
(a) Photographs of CT26 tumors at different time points p.i. with S. Typhimurium. (a left) Photographs of the fur side of the tumors. (a right) Photographs of the ventral side of the tumors. (b) HE-stained paraffin sections of CT26 tumors at different time points p.i. with S. Typhimurium. (b left) Low magnification overviews. (b right) Higher magnifications of the tumors shown in (b left). 6 h–12 h: High magnifications of erythrocyte-containing (stars) central tumor areas. 15 h–24 h: High magnifications of the transition between developing necrosis (N) and remaining vital tumor rim (V). Arrows point exemplarily at neutrophils. Black bars correspond to 500 µm in (b left) and 100 µm in (b right). (c) Hemoglobin content in CT26 tumors at different time points p.i. with S. Typhimurium. Bars show standard deviations of means. Experiments were repeated three times with identical results.
Figure 3
Figure 3. TNF-α release into the blood of S. Typhimurium-infected, CT26 tumor-bearing mice.
(a) RT-PCRs were performed with RNA isolated from S. Typhimurium-infected CT26 cells (in vitro) and from CT26 tumors of S. Typhimurium-infected, tumor-bearing BALB/c mice (in vivo) at the indicated time points. The amplification product has a size of 212 bp. (b) TNF-α concentration in the blood of CT26 tumor-bearing BALB/c mice at different times p.i. determined using TNF sensitive L929 fibroblasts. Error bars show standard deviations of means. Results are representative for at least two independent experiments with 3–5 mice per group.
Figure 4
Figure 4. Blood influx into CT26 tumors after treatment with TNF-α.
CT26 tumor-bearing BALB/c mice were treated i.v. or i.t. with the indicated amounts of recombinant TNF-α. Photographs were taken and histology was performed 6 h post treatment. (a) Photographs of tumors of differently treated mice. (a left) Photographs of the fur side of the tumors. (a right) Photographs of the internal side of the tumors. (b) HE-stained paraffin sections of the tumors shown in (a). The black bars correspond to 200 µm in the 10×magnification pictures, to 100 µm in the 20×magnification pictures and to 50 µm in the 40×magnification pictures. (N) stands for necrotic region, the stars show accumulations of erythrocytes.(c) Hemoglobin content in CT26 tumors of BALB/c mice after injection of 200 ng TNF-α i.v.. Results are representative for at least two independent experiments with 3–5 mice per group.
Figure 5
Figure 5. Inhibition of TNF-α in S. Typhimurium-infected BALB/c mice retards blood influx into tumors and bacterial colonization.
(a) TNF-α concentration in the blood of S. Typhimurium-infected, CT26 tumor-bearing BALB/c mice (black bars) and of S. Typhimurium-infected, anti-TNF-α treated, CT26 tumor-bearing BALB/c mice (grey bars). Error bars show standard deviations of means. (b) Photographs of CT26 tumors of an S. Typhimurium-infected tumor (left set of pictures) and an S. Typhimurium-infected, anti-TNF-α treated tumor (right set of pictures). The left column of each set of pictures show the fur side of the tumors, the right pictures show the ventral side of the tumors. (c) Hemoglobin content in CT26 tumors of S. Typhimurium-infected BALB/c mice (black bars) and S. Typhimurium-infected, anti-TNF-α treated BALB/c mice (grey bars). Error bars show standard deviations of means. (*) At 6 h p.i. the difference of hemoglobin content in the tumors is significant with p<0.05. (d) Bacterial number per g tumor tissue in S. Typhimurium-infected tumor-bearing BALB/c mice (black bars) and S. Typhimurium-infected, anti-TNF-α treated tumor-bearing BALB/c mice (grey bars). Error bars show standard deviations of means. (*) At 12 h p.i. the difference of bacterial numbers between differently treated tumors is significant with p<0.05. Results are representative for at least two independent experiments with 3–5 mice per group. The second experiment also included an isotype control where normal rat IgG was injected into the mice of the control group (data not shown).
Figure 6
Figure 6. Measurement of different proinflammatory cytokines in the initial phase of bacterial tumor colonization.
Concentrations of the proinflammatory cytokines TNF-α, IL-6, MCP-1, IFN-γ, IL-10 and IL-12(p70) in blood of uninfected (0 h) and S. Typhimurium-infected (2 h, 6 h) CT26 tumor-bearing BALB/c mice at different time points p.i.. Error bars show standard deviations. The differences between S. Typhimurium-infected mice and uninfected control mice are significant with p<0.01–0.05. The 6 h-values for IL-10 and IL-12 are not significantly different from non-infected mice. According to the manufacturer's protocol, the values for IL-12 can be considered background. The exact values for MCP-1 are higher than plotted here since several samples reached the plateau. Results are representative for two independent experiments with 3–5 mice.

References

    1. Coley WB. The treatment of malignant tumors by repeated inoculations of erysipelas. With a report of ten original cases. 1893. Clin Orthop Relat Res. 1991:3-11. - PubMed
    1. Van Mellaert L, Barbe S, Anne J. Clostridium spores as anti-tumour agents. Trends Microbiol. 2006;14:190–196. - PubMed
    1. Pawelek JM, Low KB, Bermudes D. Bacteria as tumour-targeting vectors. Lancet Oncol. 2003;4:548–556. - PubMed
    1. Zhao M, Yang M, Li XM, Jiang P, Baranov E, et al. Tumor-targeting bacterial therapy with amino acid auxotrophs of GFP-expressing Salmonella typhimurium. Proc Natl Acad Sci U S A. 2005;102:755–760. - PMC - PubMed
    1. Agrawal N, Bettegowda C, Cheong I, Geschwind JF, Drake CG, et al. Bacteriolytic therapy can generate a potent immune response against experimental tumors. Proc Natl Acad Sci U S A. 2004;101:15172–15177. - PMC - PubMed

Publication types

LinkOut - more resources