. 2008 May 6;2(2):24103.
doi: 10.1063/1.2930817.

Size-dependent trajectories of DNA macromolecules due to insulative dielectrophoresis in submicrometer-deep fluidic channels

Size-dependent trajectories of DNA macromolecules due to insulative dielectrophoresis in submicrometer-deep fluidic channels

Gea O F Parikesit et al. Biomicrofluidics. .

Abstract

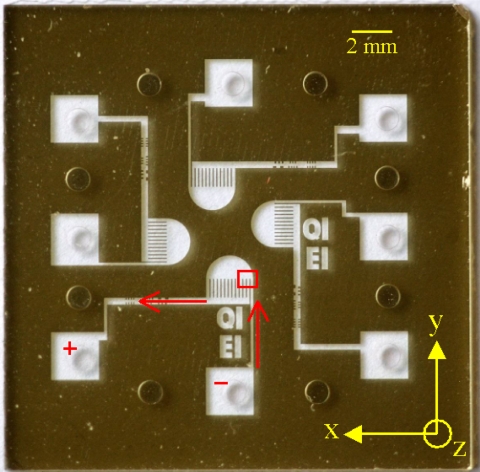
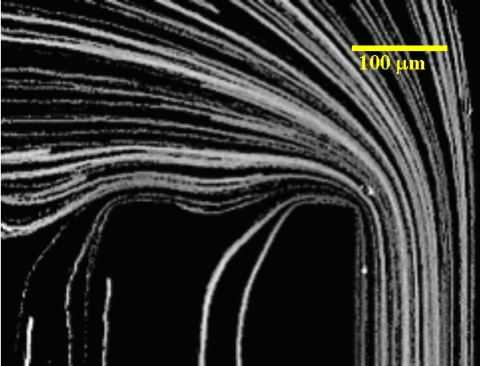
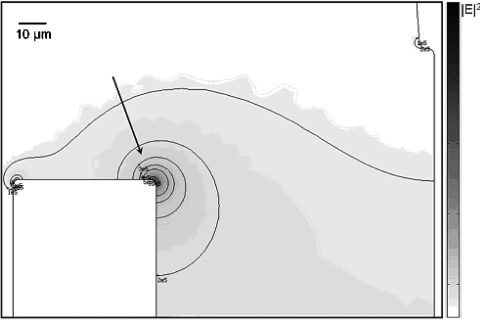
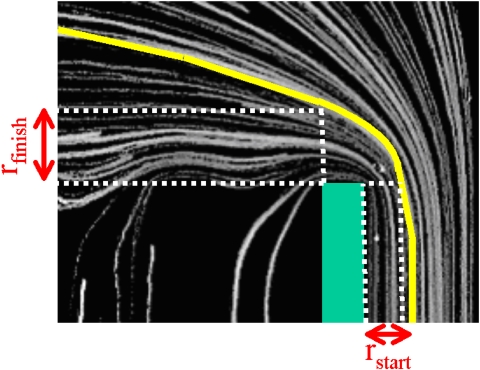
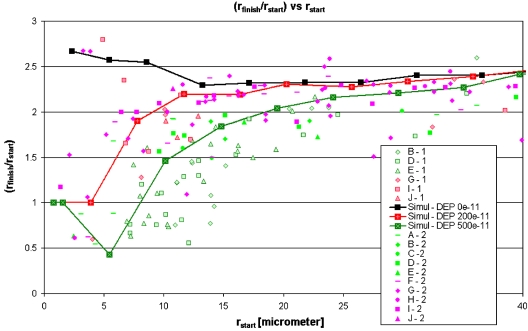
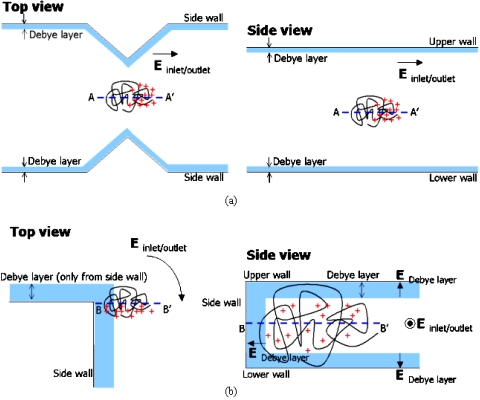
In this paper, we demonstrate for the first time that insulative dielectrophoresis can induce size-dependent trajectories of DNA macromolecules. We experimentally use lambda (48.5 kbp) and T4GT7 (165.6 kbp) DNA molecules flowing continuously around a sharp corner inside fluidic channels with a depth of 0.4 mum. Numerical simulation of the electrokinetic force distribution inside the channels is in qualitative agreement with our experimentally observed trajectories. We discuss a possible physical mechanism for the DNA polarization and dielectrophoresis inside confining channels, based on the observed dielectrophoresis responses due to different DNA sizes and various electric fields applied between the inlet and the outlet. The proposed physical mechanism indicates that further extensive investigations, both theoretically and experimentally, would be very useful to better elucidate the forces involved at DNA dielectrophoresis. When applied for size-based sorting of DNA molecules, our sorting method offers two major advantages compared to earlier attempts with insulative dielectrophoresis: Its continuous operation allows for high-throughput analysis, and it only requires electric field strengths as low as approximately 10 Vcm.


Figures

Figure 1
Figure 1
A photograph of the fluidic channels (courtesy of Hans Stakelbeek∕FMAX). Four of similar channels are fabricated in the same chip. The red arrows indicate the flow direction, the red rectangle shows the region of observation, while the ”+” and ”−” marks represent the polarities of the dc electrodes in the experiment. A Cartesian coordinate system, used in the analysis, is also shown. The scale bar represents 2 mm.
Figure 2
Figure 2
A typical example of a trajectory image, showing the trajectories of DNA molecules flowing at the region of observation; this is obtained simply by adding up original fluorescent images in each measurement set. The scale bar represents 100 μm.
Figure 3
Figure 3
A two-dimensional numerical simulation of the electric field squared, ∣E2; the simulation was performed on the whole device shown in Fig. 1, but here we specifically show only the region of our experimental observation, i.e., at the end of the “inlet channel,” because the significant electric field gradients (induced by electrodes in inlet and outlet) only occur here. The color bar has maximum and minimum values of 2.233×10⁶ V2 and 1.011×10⁻⁸ V2, respectively. Several iso-level contours of ∣E2 are also shown (for ∣E2 equal to 1×10⁶, 0.5×10⁶, 0.4×10⁶, 0.3×10⁶, 0.2×10⁶, and 0.1×10⁶ V2) as a quantitative visual aid. The dark region at one of the wall corners, indicated by the arrow, shows the location with the highest value of ∣E2 throughout the branched U-turn nanofluidic channel. The region with the nonzero gradient of ∣E2 is around that corner. The scale bar represents 10 μm.
Figure 4
Figure 4
The parameters used in the analysis are the “start distance,” rstart, and the “finish distance,” rfinish, measured from the corners in the walls. In this figure, we show how to determine these parameters for an exemplary trajectory, highlighted with the yellow line. The green box represents the wall with the sharp corner.
Figure 5
Figure 5
The plot of (rfinishrstart) vs rstart along with the simulated trajectories for all rstart values.
Figure 6
Figure 6
Schematic drawings (not to scale) of (a) the model used by Chou et al. (Ref. 5) and (b) the model used for our case. The blue areas represent the Debye layers. The red ”+” marks represent the counterions.

References

    1. Pohl H. A., Dielectrophoresis—The Behaviour of Neutral Matter in Nonuniform Electric Field (Cambridge University Press, Cambridge, 1978).
    1. Jones T. B., Electromechanics of Particles (Cambridge University Press, Cambridge, 1995).
    1. Cummings E. B. and Singh A. K., Anal. Chem. ANCHAM10.1021/ac0340612 75, 4724 (2003). - DOI - PubMed
    1. Ajdari A. and Prost J., Proc. Natl. Acad. Sci. U.S.A. PNASA610.1073/pnas.88.10.4468 88, 4468 (1991). - DOI - PMC - PubMed
    1. Chou C.-F., Tegenfeldt J. O., Bakajin O., Chan S. Y., Cox E. C., Darnton D. T., and Austin R. H., Biophys. J. 83, 2170 (2002). - PMC - PubMed

LinkOut - more resources