. 2009 Oct;18(10):2172-82.
doi: 10.1002/pro.231.

Differential stability of the bovine prion protein upon urea unfolding

Affiliations

Differential stability of the bovine prion protein upon urea unfolding

Olivier Julien et al. Protein Sci. 2009 Oct.

Abstract

Prion diseases, or transmissible spongiform encephalopathies, are a group of infectious neurological diseases associated with the structural conversion of an endogenous protein (PrP) in the central nervous system. There are two major forms of this protein: the native and noninfectious cellular form, PrP(C); and the misfolded, infectious, and proteinase K-resistant form, PrP(Sc). The C-terminal domain of PrP(C) is mainly alpha-helical in structure, whereas PrP(Sc) in known to aggregate into an assembly of beta-sheets, forming amyloid fibrils. To identify the regions of PrP(C) potentially involved in the initial steps of the conversion to the infectious conformation, we have used high-resolution NMR spectroscopy to characterize the stability and structure of bovine recombinant PrP(C) (residues 121 to 230) during unfolding with the denaturant urea. Analysis of the 800 MHz (1)H NMR spectra reveals region-specific information about the structural changes occurring upon unfolding. Our data suggest that the dissociation of the native beta-sheet of PrP(C) is a primary step in the urea-induced unfolding process, while strong hydrophobic interactions between helices alpha1 and alpha3, and between alpha2 and alpha3, stabilize these regions even at very high concentrations of urea.


Figures
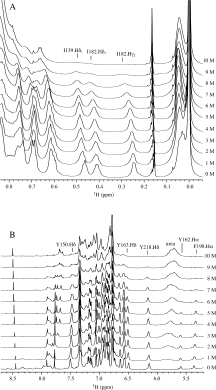
Figure 1
Figure 1
Titration from 0 to 10 M urea of recombinant bPrP121–230 followed by 1D 1H NMR recorded at 800 MHz. (A) Stacked plot focusing on the methyl region from 0 to 0.8 ppm. I139.Hδ1, I182.Hδ1, and I182.Hγ2 resonances are identified. (B) Stacked plot focusing on the aromatic region from 5.2 to 8.7 ppm. F198.Hα, Y162.Hα, Y218.Hδ, Y163.Hδ, and Y150.Hδ resonances are identified. The spectra were all referenced on the DSS signal at 0 ppm.
Figure 2
Figure 2
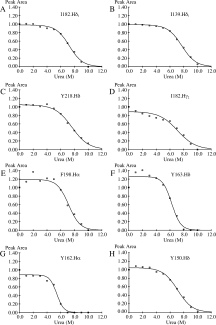
Peak area of the eight resonances identified in Figure 1, plotted as a function of the urea concentration: (A) I182.Hδ1, (B) I139.Hδ1, (C) Y218.Hδ, (D) I182.Hγ2, (E) F198.Hα, (F) Y163.Hδ, (G) Y162.Hα, and (H) Y150.Hδ. The [D]1/2 and m-value are reported for each residue.
Figure 3
Figure 3
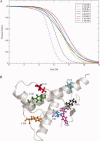
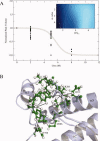
(A) Fraction of the native conformation of different residues of bPrP121–230 as a function of the urea concentration. The dash lines correspond to the denaturation curves of resonances Y162.Hα and Y163.Hδ. (B) Cartoon representation of bPrPC (PDB 1dyz). The different residues are displayed in ball-and-stick in the structure, and colored as in A).
Figure 4
Figure 4
Four 2D 1H-1H NOESY spectra of bPrPC acquired at 800 MHz. The spectra show the decreased number of NOE cross-peaks, as the concentration of urea is increased: (A) 0M urea, (B) 2M urea, (C) 5M urea, (D) 8M urea.
Figure 5
Figure 5
Inter-residue NOEs found in the β1-strand region of bPrPC. (A) Normalized NOE cross-peak volumes as a function of the concentration of urea for residues located in the β1-strand. The contour plot (inset) shows the sum of the square of the error for a global fit of the data yielding a m-value of 1.5 kJ mol–1 M–1 and a [D]1/2 of 3.5M. The gray line on the graph corresponds to a denaturation curve with these thermodynamic parameters. (B) Cartoon representation of the β-sheet region of bPrPC. The following inter-residue 1H-1H NOEs contacts are shown with black lines: 128.Hδ-182.Hδ1, 162.Hδ-130.Hδ2, 162.Hα-130.Hδ1, 162.Hɛ-130.Hδ1, 162.Hδ-130.Hδ1, 128.Hɛ-182.Hγ2, 128.Hɛ-182.Hδ1, 128.Hδ-182.Hγ2, 162.Hɛ-130.Hδ2, 163.Hɛ-131.Hα1, 128.Hδ-125.Hα, 162.Hα-130.Hα, 163.Hɛ-131.Hα2. The heavy atoms of the residues found in the β1-strand are colored in yellow, while the remaining atoms from other regions are colored in green. The hydrogen atoms are all colored in white.
Figure 6
Figure 6
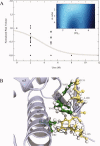
Inter-residue NOEs found in the β2-strand region of bPrPC. (A) Normalized NOE cross-peak volumes as a function of the concentration of urea, for residues located in the β2-strand region but not making contacts with residues located in the β1-strand. The contour plot (inset) shows the sum of the square of the error for a global fit of the data yielding a m-value of 2.6 kJ mol–1 M–1 and a [D]1/2 of 5.7M. The gray line on the graph corresponds to a denaturation curve with these thermodynamic parameters. (B) Cartoon representation of the β-sheet region of bPrPC. The following inter-residue 1H-1H NOEs contacts are shown with black lines: 162.Hβ1-182.Hγ2, 214.Hα-161.Hγ2, 161.Hα-183.Hγ2, 162.Hδ-182.Hγ2, 162.Hδ-183.Hγ2, 163.Hɛ-217.Hγ, 163.Hɛ-221.Hγ, 162.Hδ-183.Hα. The heavy atoms are colored in green and the hydrogen atoms are colored in white.
Figure 7
Figure 7
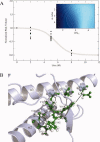
Inter-residue NOEs found in the α1-helix region of bPrPC. (A) Normalized NOE cross-peak volumes as a function of the concentration of urea, for residues located in the α1-helix region (residues 138–157). The contour plot (inset) shows the sum of the square of the error for a global fit of the data yielding a m-value of 3.6 kJ mol–1 M–1 and a [D]1/2 of 5.7M. The gray line on the graph corresponds to a denaturation curve with these thermodynamic parameters. (B) Cartoon representation of the α1 region of bPrPC. The following inter-residue 1H-1H NOE contacts are shown with black lines: 139.Hδ1-212.Hγ, 139.Hδ1-212.Hβ, 209.Hα-139.Hδ1, 139.Hδ1-209.Hγ2, 139.Hδ1-208.Hβ, 139.Hδ1-212.Hγ, 206.Hɛ-157.Hɛ, 141.Hζ-139.Hγ2, 141.Hɛ-139.Hγ2, 141.Hδ-139.Hγ2, 141.Hζ-139.Hδ1, 141.Hɛ-139.Hγ1, 157.Hɛ-154.Hα, 157.Hδ-154.Hα, 150.Hɛ-138.Hα, 150.Hɛ-157.Hɛ, 198.Hδ-157.Hɛ, 150.Hδ-157.Hɛ. The heavy atoms are colored in green and the hydrogen atoms are colored in white.
Figure 8
Figure 8
Inter-residue NOEs of bPrPC identified at 8M urea. (A) Normalized NOE cross-peak volumes as a function of the concentration of urea, for NOEs still identifiable at 8M urea. The contour plot (inset) shows the sum of the square of the error for a global fit of the data yielding a m-value of 2.2 kJ mol–1 M–1 and a [D]1/2 of 6.3M. The gray line on the graph corresponds to a denaturation curve with these thermodynamic parameters. (B) Cartoon representation of bPrPC. The following inter-residue 1H-1H NOEs contacts are shown with black lines: 162.Hβ-182.Hγ2, 209.Hα-139.Hδ1, 161.Hα-183.Hγ2, 139.Hδ1-212.Hγ, 218.Hδ-166.Hγ2, 218.Hɛ-166.Hγ2, 162.Hδ-183.Hα, 150.Hɛ-138.Hα. The heavy atoms are colored in green and the hydrogen atoms are colored in white.

References

    1. Prusiner SB. Novel proteinaceous infectious particles cause scrapie. Science. 1982;216:136–144. - PubMed
    1. Prusiner SB. Prions. Proc Natl Acad Sci USA. 1998;95:13363–13383. - PMC - PubMed
    1. Collinge J. Prion diseases of humans and animals: their causes and molecular basis. Annu Rev Neurosci. 2001;24:519–550. - PubMed
    1. Weissmann C. The state of the prion. Nat Rev Microbiol. 2004;2:861–871. - PubMed
    1. Caughey B, Baron GS. Prions and their partners in crime. Nature. 2006;443:803–810. - PubMed

Publication types