. 2009:21:151-62.
doi: 10.1007/978-3-642-02498-6_13.

Regression models of atlas appearance

Affiliations

Regression models of atlas appearance

Torsten Rohlfing et al. Inf Process Med Imaging. 2009.

Abstract

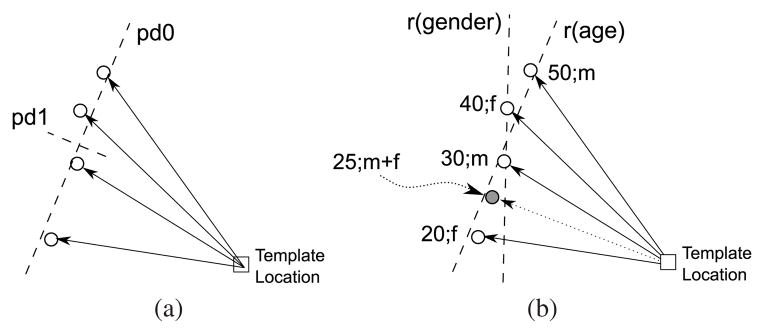
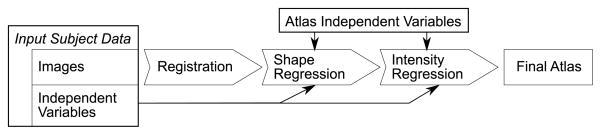
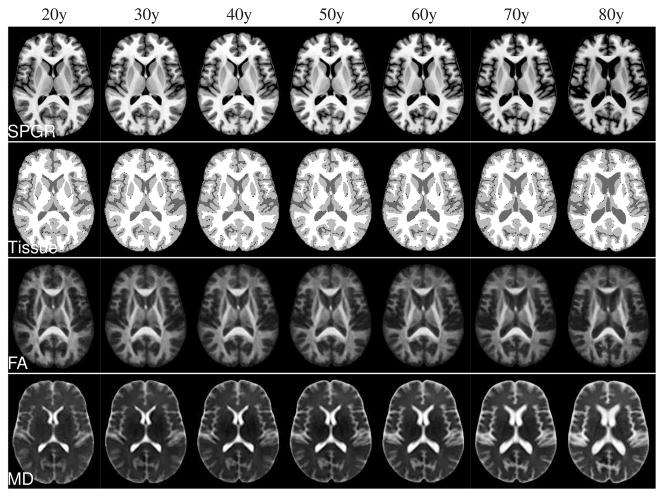
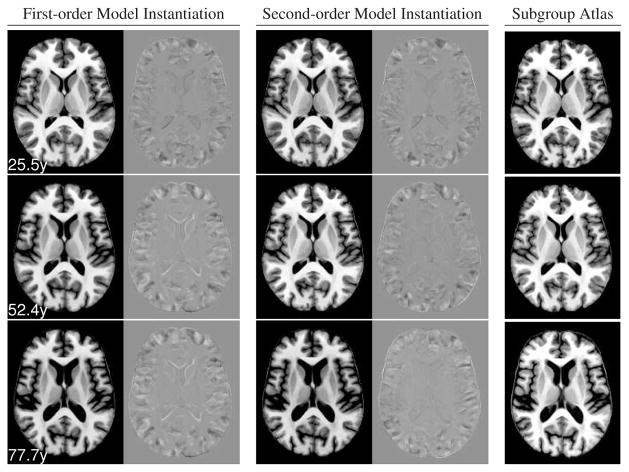
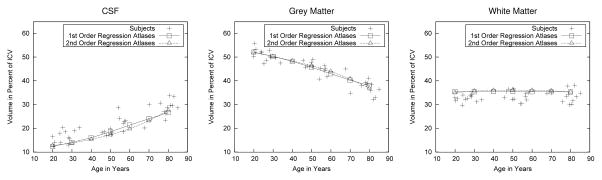
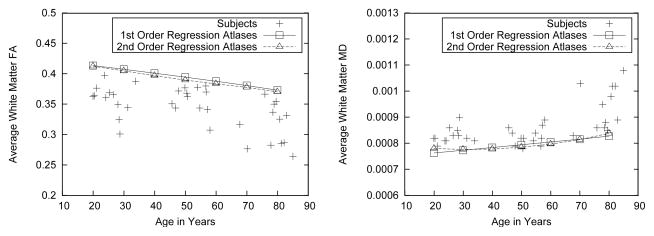
Models of object appearance based on principal components analysis provide powerful and versatile tools in computer vision and medical image analysis. A major shortcoming is that they rely entirely on the training data to extract principal modes of appearance variation and ignore underlying variables (e.g., subject age, gender). This paper introduces an appearance modeling framework based instead on generalized multi-linear regression. The training of regression appearance models is controlled by independent variables. This makes it straightforward to create model instances for specific values of these variables, which is akin to model interpolation. We demonstrate the new framework by creating an appearance model of the human brain from MR images of 36 subjects. Instances of the model created for different ages are compared with average shape atlases created from age-matched sub-populations. Relative tissue volumes vs. age in models are also compared with tissue volumes vs. subject age in the original images. In both experiments, we found excellent agreement between the regression models and the comparison data. We conclude that regression appearance models are a promising new technique for image analysis, with one potential application being the representation of a continuum of mutually consistent, age-specific atlases of the human brain.


Figures

Fig. 1
Fig. 1
Schematic comparison of shape models based on PCA and regression, each using the same mapping of one template point location to four corresponding data point locations. (a) The PCA-based model provides two orthogonal principal directions based entirely on the data point locations. (b) The regression-based model (here, multi-linear model) provides one regression line per independent variable (here, age and sex). The regression lines are not necessarily orthogonal. Unlike the PCA-based model, the regression model can be instantiated for specific independent variable values (here, marked by the solid circle, 25 years of age, half male/half female).
Fig. 2
Fig. 2
Data flow diagram. Coordinate transformations are determined between the input images via image registration. The resulting transformations are then used to create a shape regression model based on the subjects’ independent variable values. The latter are then also used to obtain local regression models of pixel intensities. The combined shape and intensity models are instantiated for selected atlas independent variables to create the final atlas.
Fig. 3
Fig. 3
Comparison of sex vs. age effects in atlases instantiated from the same 36-subject regression model. Top row: all-male atlases, middle row: male/female mixed-sex atlases, bottom row: all-female atlases. Note that affine differences including scale were eliminated from the model (see text).
Fig. 4
Fig. 4
Discrete instances created from the continuous atlas regression model for ages 20 through 80 years in 10 year increments. Rows from top to bottom: SPGR, maximum-likelihood tissue segmentation, DTI-FA, and DTI-MD.
Fig. 5
Fig. 5
Comparison of regression atlases instantiated for the mean subject age in each group of the three age groups with atlases computed independently from each group. Top to bottom: young, middle-aged, elderly group. Left column: SPGR for first-order model regression atlas and difference with subgroup atlas. Middle column: SPGR for second-order model regression atlas and difference with subgroup atlas. Right column: subgroup atlas. All difference image are shown using the same gray level scale, centered at zero.
Fig. 6
Fig. 6
Comparison of tissue volume vs. age in subjects and regression atlases. Left to right: CSF, gray matter, white matter. All tissue volumes are relative to the ICV to account for head size differences. Measurements for first-order and second-order regression atlases are connected by line segments. There are no regression lines in these figures, i.e., the lines representing the regression atlases are measurements in their own right and not fits of the subject measurements.
Fig. 7
Fig. 7
FA and MD vs age effects in regression atlases compared with individual subjects. Left: mean FA, averaged over all pixels classified as white matter in each subject and each atlas. Right: mean MD, averaged over all white matter pixels.

References

    1. Cootes TF, Taylor CJ, Cooper DH, Graham J. Active shape models – Their training and application. Comput Vision Image Understanding. 1995 Jan;61(1):38–59.
    1. Sozou P, Cootes T, Taylor C, Di-Mauro E. A non-linear generalisation of PDMs using polynomial regression. Proceedings of the Conference on British Machine Vision; Surrey, UK: BMVA Press; 1994. pp. 397–406.
    1. Davis BC, Fletcher PT, Bullitt E, Joshi S. Population shape regression from random design data. IEEE 11th International Conference on Computer Vision, ICCV; Oct. 2007; pp. 1–7.
    1. Miller MI, Christensen GE, Amit Y, Grenander U. Mathematical textbook of deformable neuroanatomies. Proc Natl Acad Sci USA. 1993;90(24):11944–11948. - PMC - PubMed
    1. Holmes CJ, Hoge R, Collins L, Woods R, Toga AW, Evans AC. Enhancement of MR images using registration for signal averaging. J Comput Assist Tomogr. 1998 Mar;22(2):324–333. - PubMed

Publication types

MeSH terms

LinkOut - more resources