. 2009 Aug 25;54(9):840-50.
doi: 10.1016/j.jacc.2009.06.008.

Autonomic nervous system activity measured directly and QT interval variability in normal and pacing-induced tachycardia heart failure dogs

Affiliations

Autonomic nervous system activity measured directly and QT interval variability in normal and pacing-induced tachycardia heart failure dogs

Gianfranco Piccirillo et al. J Am Coll Cardiol. .

Abstract

Objectives: This study sought to find out more about the relationship between sympathetic and vagal nerve activity and the cardiac repolarization in a canine model of pacing-induced tachycardia congestive heart failure (CHF).

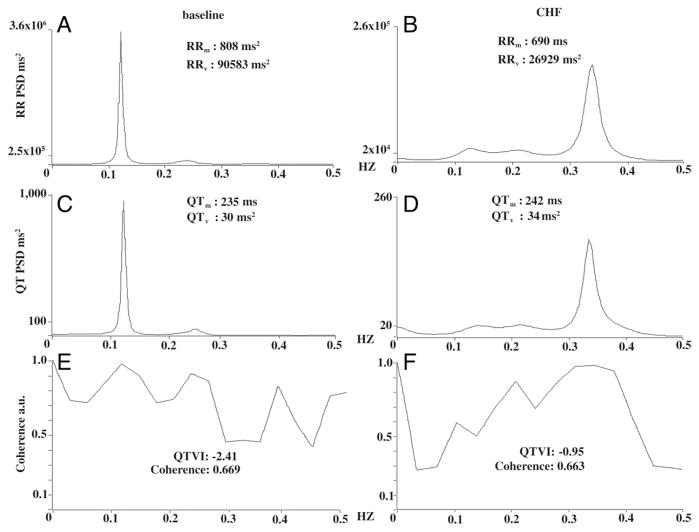
Background: The QT variability index (QTVI), a noninvasive marker of temporal cardiac repolarization dispersion, is among the risk factors for sudden death during CHF. Among factors influencing this variable are the myocardial damage and the autonomic nervous system activity typical of dilated cardiomyopathy.

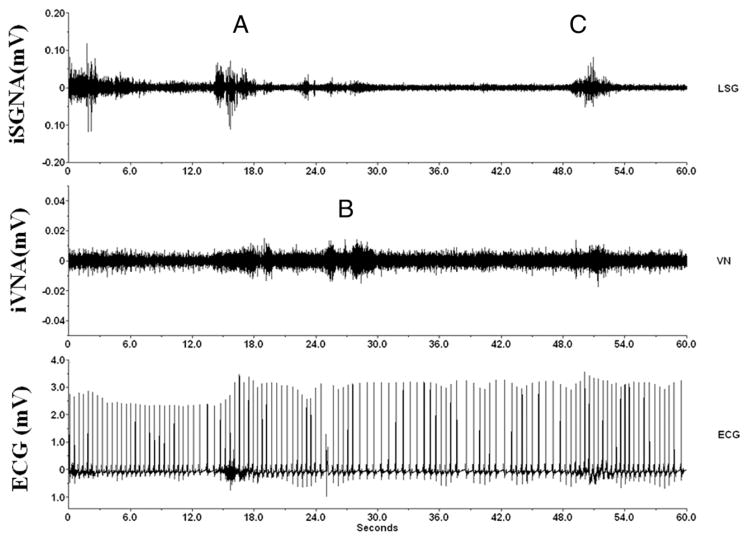
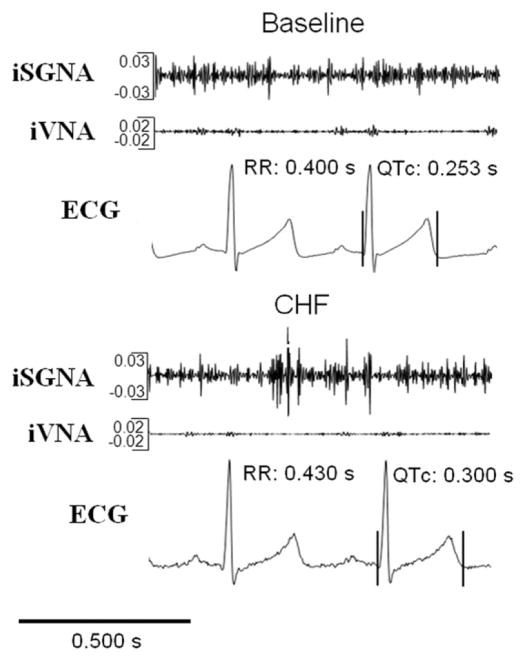
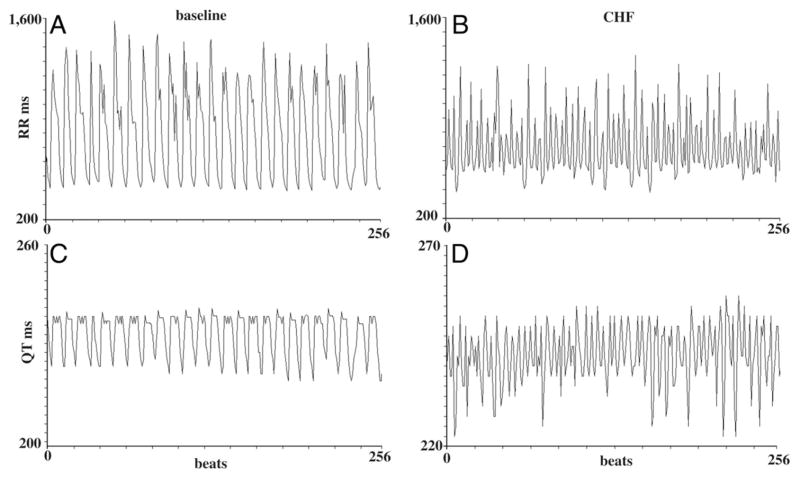
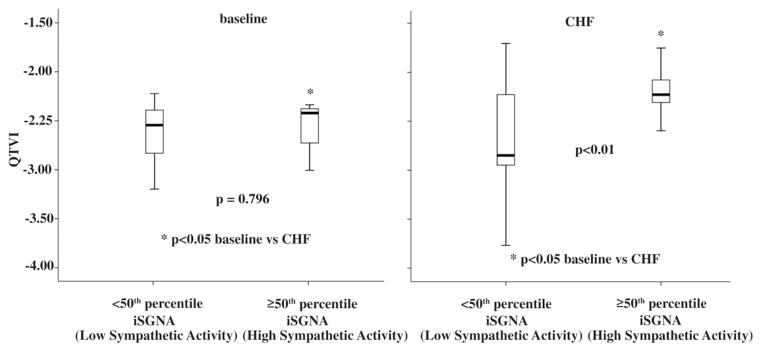
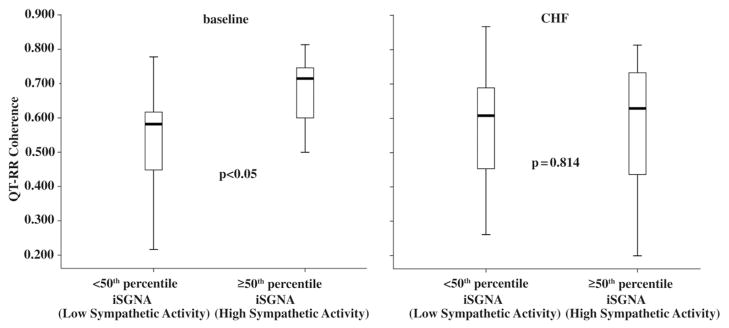
Methods: We assessed autonomic nervous system activity recorded from an implanted data transmitter that monitored integrated left stellate-ganglion nervous activity, integrated vagus nerve activity, and electrocardiogram. We collected 36 segments recorded at baseline and 36 after induced CHF. We then arbitrarily identified recording segments as containing low or high sympathetic activity values, and we compared corrected QT intervals and the QTVI under a given sympathetic activity condition at baseline and after inducing CHF.

Results: In the high sympathetic activity subgroup, both QT variables increased from baseline to CHF (corrected QT intervals, p < 0.01; QTVI, p < 0.05) whereas in the low sympathetic activity subgroup they remained unchanged. The baseline QTVI correlated inversely with integrated vagus nerve activity (r(2) = 0.16; beta = -0.47; p < 0.05) whereas, during CHF, the QTVI correlated directly with integrated left stellate-ganglion nervous activity (r(2) = 0.32; beta = 0.27, p < 0.01).

Conclusions: During CHF, sympathetic activation is associated with an increase in the QT interval and QTVI. Because these changes vary over time, they could result from myocardial structural damage and sympathetic activation combined. Conversely, under normal conditions, no relationship exists between sympathetic activation and the QT variables.


Figures

Figure 1
Figure 1. Nerve and ECG Recordings
Example of simultaneous integrated stellate ganglion nerve activity (iSGNA) and integrated vagal nerve activity (iVNA) at baseline (before pacing-induced congestive heart failure) in an ambulatory dog. (Top) iSGNA; (middle) iVNA; (bottom) electrocardiographic (ECG) trace. In the upper trace, A indicates between the 12th and 16th s, an epoch of high sympathetic activity followed 3 s later by an epoch of fast heart rate (about 120 beats/min, between the 18th and 24th s). This sympathetic activity is followed almost immediately, between the 24th and 30th s, by a vagal increase with lower heart rate (B) (from 120 to 90 beats/min, between the 30th and 36th s), and last (C), a new increase in sympathetic activity after the 48th s, and a heart rate increase (from 90 to 130 beats/min, around the 54th s). LSG = left stellate ganglion nerve; VN = vagal nerve.
Figure 2
Figure 2. Integrate Nerve Recordings and QT Interval
Example of assessment of iSGNA, iVNA, and its influence on RR and QT intervals at baseline and after pacing-induced congestive heart failure (CHF) in an ambulatory dog. QTc = corrected QT interval; other abbreviations as in Figure 1.
Figure 3
Figure 3. RR and QT Intervals in 256 Beats
RR and QT intervals recorded in the same dog at baseline (A and C) and during congestive heart failure (CHF) (B and D) under the same sympathetic activity levels. A and C show the RR recorded and QT intervals over 256 consecutive cycles at baseline, and B and D show the same data during CHF.
Figure 4
Figure 4. Power Spectral Analysis, Coherence, and QTVI
RR and QT spectra obtained from the recordings of Figure 3. As in Figure 3, we reported the spectrum in the same dog at baseline (left panels) and during congestive heart failure (CHF) (right panels) under the same sympathetic activity levels. Panel A shows the power spectra for RR intervals at baseline, panel B during CHF. Note the dramatic reduction in RR-interval variance (RRv), less than two-thirds the value during CHF, and the reduced RR interval (RRm). Panels C and D show the spectra for QT intervals recorded at baseline and during CHF. Note that QT variance (QTv) and the mean QT interval (QTm) both increase. Last, panels E (baseline) and F (CHF) give coherence and corresponding QT variability index (QTVI) values calculated from the respective RR (baseline: A; CHF: B) and QT intervals (baseline: C; CHF: D) (QTVI = QTv/[QTm]2/RRv/[RRm]2). Note the increased QTVI during CHF. Note also that maximum coherence at baseline peaks at around 0.1 Hz and during in CHF at around 0.35 Hz. The maximum peak differs because the 2 synchronous spectral components RR (A) and QT (C) predominantly oscillate at a lower frequency at baseline than during CHF (0.1 and 0.35 Hz) (B and D). PSD = power spectral density in the area under the curve.
Figure 5
Figure 5. QTVI Changes in Baseline and in CHF
In the subgroup recorded at high sympathetic activity values, the QTVI was significantly lower at baseline than during CHF. In the box plots, the central line represents the median distribution. Each box spans from 25th to 75th percentile points, and error bars extend from 10th to 90th percentile points. iSGNA = integrated stellate ganglion nerve activity; other abbreviations as in Figure 4.
Figure 6
Figure 6. QT-RR Coherence Changes Between Baseline and CHF
Graph showing cross-spectral analysis (coherence) in the 6 ambulatory dogs. Note that baseline coherence increases as a function of the increase in spectral sympathetic nerve activity. In the box plots, the central line represents the median distribution. Each box spans from 25th to 75th percentile points, and error bars extend from 10th to 90th percentile points. CHF = congestive heart failure; iSGNA = integrated stellate ganglion nerve activity.

Comment in

References

    1. Zipes DP, Wellens HJ. Sudden cardiac death. Circulation. 1998;98:2334–51. - PubMed
    1. Tomaselli GF, Zipes DP. What causes sudden death in heart failure? Circ Res. 2004;95:754–63. - PubMed
    1. Jin H, Lyon AR, Akar FG. Arrhythmias mechanisms in the failing heart. Pacing Clin Electrophysiol. 2008;31:1048–56. - PubMed
    1. Berger RD, Kasper EK, Baughman KL, et al. Beat-to-beat QT interval variability. Novel evidence for repolarization lability in ischemic and nonischemic dilated cardiomyopathy. Circulation. 1997;96:1557–65. - PubMed
    1. Piccirillo G, Magnanti M, Matera S, et al. Age and QT variability index during free breathing, controlled breathing and tilt in patients with chronic heart failure and healthy control subjects. Transl Res. 2006;148:72–8. - PubMed

Publication types

MeSH terms