. 2009 Oct 7;28(19):2908-18.
doi: 10.1038/emboj.2009.239. Epub 2009 Aug 20.

FoxM1, a critical regulator of oxidative stress during oncogenesis

Affiliations

FoxM1, a critical regulator of oxidative stress during oncogenesis

Hyun Jung Park et al. EMBO J. .

Abstract

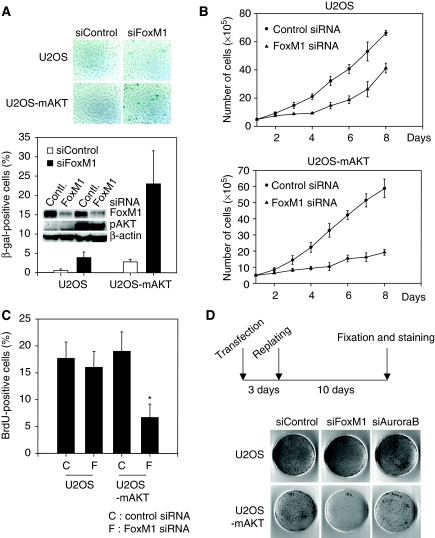
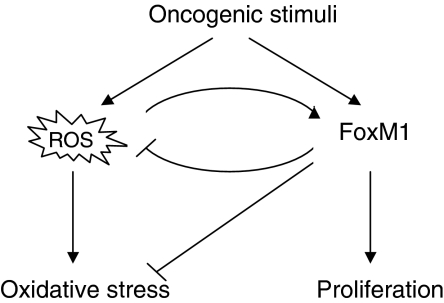
The transcription factor FoxM1 is over-expressed in most human malignancies. Although it is evident that FoxM1 has critical functions in tumour development and progression, the mechanisms by which FoxM1 participates in those processes are not understood. Here, we describe an essential role of FoxM1 in the regulation of oxidative stress that contributes to malignant transformation and tumour cell survival. We identify a negative feedback loop involving FoxM1 that regulates reactive oxygen species (ROS) in proliferating cells. We show that induction of FoxM1 by oncogenic Ras requires ROS. Elevated FoxM1, in turn, downregulates ROS levels by stimulating expression of ROS scavenger genes, such as MnSOD, catalase and PRDX3. FoxM1 depletion sensitizes cells to oxidative stress and increases oncogene-induced premature senescence. Moreover, tumour cells expressing activated AKT1 are 'addicted' to FoxM1, as they require continuous presence of FoxM1 for survival. Together, our results identify FoxM1 as a key regulator of ROS in dividing cells, and provide insights into the mechanism how tumour cells use FoxM1 to control oxidative stress to escape premature senescence and apoptosis.


Conflict of interest statement

The authors declare that they have no conflict of interest.

Figures

Figure 1
Figure 1
Oncogenic Ras-induced FoxM1 expression requires ROS. (A) Immortalized MEFs infected with control or H-RasV12 retrovirus. Four days after selection total cell extracts were analysed for expression of FoxM1 by immunoblotting (upper) and for ROS levels by DHE fluorescence, as described in ‘Materials and methods' (lower). (B) Cells expressing H-RasV12 were treated with DMSO, 1 mM Tempol or 50 μM MnTM-2-PyP. Total cell extracts and total RNA from the treated cells were analysed for the FoxM1 protein (upper) and mRNA by RT–PCR (lower). Bar graph presents mean±standard deviation (s.d.) of three experiments (*P<0.05). (C) Immortalized MEFs were incubated with Tempol containing media for indicated times. Cell extracts were then subjected to immunoblotting (upper) or BrdU-incorporation assay (lower). Bar graph presents mean±s.d. (n=3; *P<0.05). (D) Cells were treated with superoxide dismutase (SOD) inhibitor, diethyldithiocarbamate (DDC) for 16 h and collected for immunoblotting to analyse FoxM1 levels. (E) Cells were maintained in low serum media (2% FBS) for 48 h and treated with hydrogen peroxide (H2O2) for the next 16 h. FoxM1 levels were analysed by western blotting. β-actin serves as loading control.
Figure 2
Figure 2
FoxM1 induction is critical for cellular transformation by H-RasV12. (A) FoxM1fl/fl MEFs expressing H-RasV12 were infected with AdLacZ or AdCre. The MEF cells were then grown on soft agar for 14 days. Bar graph is expressed as a percentage of LacZ-infected cells (mean±s.d.; n=3). (B) The IMR90 cells stably expressing H-RasV12-ER were transfected with control or two different FoxM1 siRNA duplexes (siFoxM1#1 and siFoxM1#2) and incubated with or without 4-OHT for indicted times. Efficient knockdown of FoxM1 was assayed by immunoblotting (upper panel). SA-β-Gal assay was performed and positively stained cells were counted (mean±s.d. of three experiments; **P<0.01) (lower panel).
Figure 3
Figure 3
FoxM1 protects cells from oxidative stress. (AD) IMR90 cells were transfected with control siRNA or FoxM1 siRNA (50 nM) for 72 h. (A) Cell extracts (150 μg) were prepared for western blotting to analyse FoxM1 knockdown efficiency and phospho-p38 (pp38) levels. In addition, FoxO1 and FoxA levels were determined by western analysis demonstrating specificity of the FoxM1–siRNAs (upper panel). Cells were fixed and subjected to senescence-associated-β-Gal (SA-β-Gal) staining (lower panel). (B) Cells were treated with 10 μM p38 inhibitor (SB203580), NAC (2 mM) or 50units/ml catalase after 4 h of siRNA transfection. Activation of p38 MAPK was analysed by immunoblotting (upper panel). SA-β-Gal staining was performed and positive cells were counted. Bar graph presents mean±s.d. (n=3; *P<0.05) (lower panel). (C) Cells were treated with indicated concentrations of H2O2 for 3 h. The total cell extracts (75 μg) were subjected to western blotting to measure the levels of phospho-p38 and total p38 (upper panel). For the viability assay, cells were washed with PBS and incubated with fresh media for 24 h, and viable cell counts are plotted (lower panel) (mean±s.d. of three experiments; **P<0.01). (D) The siRNA-transfected cells were treated with hydrogen peroxide (100 μM) for 1 h and then washed with PBS twice. Cells were maintained in fresh media for 7 days and then subjected to SA-β-Gal assay, as described in ‘Materials and methods'.
Figure 4
Figure 4
FoxM1 induces anti-oxidant genes by directly binding to their promoter: (A, B) IMR90 cells were transfected with control or FoxM1 siRNA for 72 h. (A) Intracellular ROS level was measured using DCF-DA or DHE fluorescence probes, as described in ‘Materials and methods' (left). ROS amounts were presented as mean±s.d. of fluorescence intensity of cells. *, ***P<0.05, 0.001 as compared with control siRNA-transfected cells. Quantitative RT–PCR was performed using FoxM1, catalase, MnSOD and PRDX3 primers. RNA was prepared from control or FoxM1 siRNA-transfected cells. The data are mean±s.d. of triplicate (*P<0.05 as compared with AdLacZ-infected cells) (right). (B) The protein expression of anti-oxidant genes was analysed by western blotting with the indicated antibodies. (C) IMR90 fibroblasts were infected with LacZ or FoxM1 adenovirus for 48 h. Catalase and MnSOD mRNA levels were measured by quantitative RT–PCR. The data are mean±s.d. of triplicate (*P<0.05). (D) IMR90 cells were transfected with plasmid expressing T7-epitope-tagged FoxM1. The transfected cells were subjected to chromatin immunoprecipitation (ChIP) assays using a previously described procedure. A monoclonal antibody against T7-epitope or isotype-matched IgG was used for immunoprecipitation. The primers used to detect FoxM1 interaction with catalase promoter (D), MnSOD promoter (E) and the negative controls are indicated by arrows. The primer sequences are included in ‘Materials and methods'.
Figure 5
Figure 5
FoxM1 enhances mAKT-induced transformation. (A) IMR90 cells stably expressing mAKT-ER were infected with FoxM1 expressing retrovirus. mAKT was induced by adding 4-OHT for 24 h. ROS levels were determined by FACS after DCF-DA treatment and presented as mean±s.d. **P<0.01; NS, not significant (upper). The cells were maintained in culture for 3 or 7 days after 4-OHT treatment, and then subjected to SA-β-Gal assay. The data show a percentage of β-Gal-positive cells (mean±s.d.; n=3; *P<0.05) (bottom). (B) Immortalized MEFs stably expressing mAKT-ER was infected with Mock or FoxM1 retrovirus. The cells were subjected to soft agar assay with or without 4-OHT. Data shown are representatives of three independent experiments (*P<0.05).
Figure 6
Figure 6
Tumour cells expressing hyper-activated AKT are dependent on FoxM1. (AD) U2OS or mAKT-expressing U2OS cells were transfected with control or FoxM1 siRNA for 72 h. Insert (A) shows the efficient knockdown of FoxM1 by siRNA analysed by western blotting. Cells were subjected to SA-β-Gal staining (A). (B) 5 × 10⁵ cells were plated and proliferation rates were measured by counting number of cells for 8 consecutive days. Culture medium was replaced every 3 days. (C) Cells were re-plated on gelatin-coated coverslips at 4 days after siRNA transfection. The next day, cells were subjected to BrdU-incorporation assay. Data represent mean±s.d. of three independent experiments (*P<0.05). (D) Clonogenic survival was determined using the strategy depicted in the upper panel. Data shown are representative pictures of colonies from at least three independent experiments.
Figure 7
Figure 7
Model depicting FoxM1 as a sensor and regulator of oncogene-induced ROS to protect cells from oxidative stress and promote cellular proliferation and transformation.

References

    1. Bass DA, Parce JW, Dechatelet LR, Szejda P, Seeds MC, Thomas M (1983) Flow cytometric studies of oxidative product formation by neutrophils: a graded response to membrane stimulation. J Immunol 130: 1910–1917 - PubMed
    1. Biggs WH III, Meisenhelder J, Hunter T, Cavenee WK, Arden KC (1999) Protein kinase B/Akt-mediated phosphorylation promotes nuclear exclusion of the winged helix transcription factor FKHR1. Proc Natl Acad Sci USA 96: 7421–7426 - PMC - PubMed
    1. Brunet A, Bonni A, Zigmond MJ, Lin MZ, Juo P, Hu LS, Anderson MJ, Arden KC, Blenis J, Greenberg ME (1999) Akt promotes cell survival by phosphorylating and inhibiting a Forkhead transcription factor. Cell 96: 857–868 - PubMed
    1. Burdon RH (1995) Superoxide and hydrogen peroxide in relation to mammalian cell proliferation. Free Radic Biol Med 18: 775–794 - PubMed
    1. Burgering BM, Medema RH (2003) Decisions on life and death: FOXO Forkhead transcription factors are in command when PKB/Akt is off duty. J Leukoc Biol 73: 689–701 - PubMed

Publication types