Review
. 2010 Feb;12(2):233-48.
doi: 10.1089/ars.2009.2822.

Heme degradation and vascular injury

Affiliations
Review

Heme degradation and vascular injury

John D Belcher et al. Antioxid Redox Signal. 2010 Feb.

Abstract

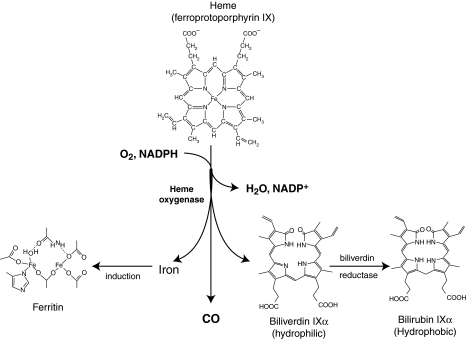
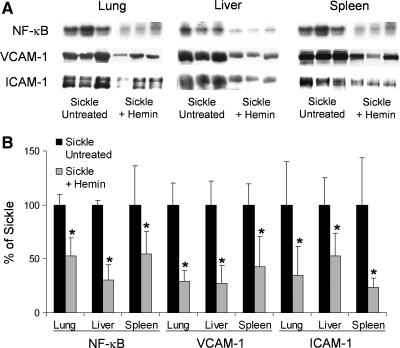
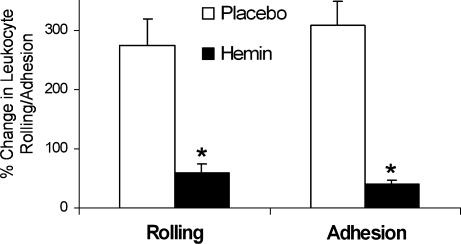
Heme is an essential molecule in aerobic organisms. Heme consists of protoporphyrin IX and a ferrous (Fe(2+)) iron atom, which has high affinity for oxygen (O(2)). Hemoglobin, the major oxygen-carrying protein in blood, is the most abundant heme-protein in animals and humans. Hemoglobin consists of four globin subunits (alpha(2)beta(2)), with each subunit carrying a heme group. Ferrous (Fe(2+)) hemoglobin is easily oxidized in circulation to ferric (Fe(3+)) hemoglobin, which readily releases free hemin. Hemin is hydrophobic and intercalates into cell membranes. Hydrogen peroxide can split the heme ring and release "free" redox-active iron, which catalytically amplifies the production of reactive oxygen species. These oxidants can oxidize lipids, proteins, and DNA; activate cell-signaling pathways and oxidant-sensitive, proinflammatory transcription factors; alter protein expression; perturb membrane channels; and induce apoptosis and cell death. Heme-derived oxidants induce recruitment of leukocytes, platelets, and red blood cells to the vessel wall; oxidize low-density lipoproteins; and consume nitric oxide. Heme metabolism, extracellular and intracellular defenses against heme, and cellular cytoprotective adaptations are emphasized. Sickle cell disease, an archetypal example of hemolysis, heme-induced oxidative stress, and cytoprotective adaptation, is reviewed.


Figures

FIG. 1.
FIG. 1.
Heme degradation by heme oxygenase. The catabolism of heme (ferroprotoporphyrin IX) via heme oxygenase requires the participation of NADPH and O2. Heme is broken and oxidized at the α-methene bridge, producing equimolar amounts of CO, ferrous iron, and biliverdin. From Wu and Wang ref. .
FIG. 2.
FIG. 2.
Hemolysis, oxidative stress, inflammation, and adhesion lead to vasoocclusion and ischemia/reperfusion injury in sickle cell disease. (A) The vicious cycle of oxidative stress, inflammation, and vasoocclusion in sickle cell disease is initiated and perpetuated through many mechanisms. Sickle red blood cells (RBCs) themselves can generate ROS, and through hemolysis, release hemoglobin and heme into plasma, which can provide iron that catalyzes further ROS production. In turn, activated leukocytes, when exposed to heme, can produce ROS and proinflammatory cytokines and promote endothelium-derived oxidants. These ROS activate NF-κB in the endothelium, which in turn promotes endothelial cell adhesion molecule (ECAM) expression on the microvasculature. Adhesion molecules such as vascular cell adhesion molecule-1 (VCAM-1), intracellular cell adhesion molecule-1 (ICAM-1), P-selectin, and others promote sickle RBCs and leukocyte adhesion, which alters vascular tone and promotes vasoocclusion and subsequent tissue ischemia. These vessels can subsequently reopen, and reperfusion leads to the conversion of xanthine dehydrogenase to xanthine oxidase, promoting more ROS production. Image from ref. . (B) Electrophoretic mobility shift assay (EMSA) demonstrates that NF-κB is upregulated in the lungs of transgenic New York sickle mice (NY-S) mice and LPS-treated normal mice [18 h after lipopolysaccharide (LPS) injection] compared with normal lung controls. The summary bar graph plots the mean ± SD lung NF-κB expression for each mouse group as a percentage of normal control mice (n = 3 for NY-S and normal control, n = 2 for LPS-treated control). *p < 0.05; **p < 0.01. (C–E) Western blots confirm upregulated adhesion molecule expression in the lungs of transgenic sickle mice and LPS-treated normal mice (18 h after LPS injection) compared with normal lung controls. Lung homogenates were prepared from three mice in each group. Homogenate proteins, representing 1 μg lung DNA per lane, were separated with SDS-PAGE, transferred electrophoretically to PVDF membranes, and immunoblotted with anti-VCAM, anti-ICAM, or anti-PECAM IgG. Sites of primary antibody binding were visualized with alkaline phosphatase–conjugated donkey anti-goat IgG. The final detection of immunoreactive bands was performed by using a chemifluorescent detection substrate. Protein bands corresponding to each adhesion molecule were quantified with fluorescence densitometry. The figure shows the adhesion-molecule bands from one representative lung from each model and a summary bar graph. The bar graph plots the mean ± SD adhesion-molecule expression for each mouse model as a percentage of normal control mice (n = 3). *p < 0.05; **p < 0.01; and ***p < 0.001. (B–E) were originally published in ref. . (F) Histology of venule in the dorsal skin of transgenic sickle mice after 1 h of hypoxia and 1 h of reoxygenation. Dorsal skin samples were taken for histologic analysis after the sickle mice were exposed to 1 h of hypoxia and 1 h of reoxygenation when ∼12% of the venules were static. Skin samples were fixed overnight in formalin, cut into 5-mm sections, embedded in paraffin, mounted on slides, and stained with hematoxylin and eosin before microscopic examination. The figure shows a venule with a suspected vascular obstruction. White arrowheads, leukocytes that appear to be adherent to the vascular endothelium; white arrows, misshapen RBCs inside the venule. Figure is adapted from ref. .
FIG. 3.
FIG. 3.
HO-1 expression is increased in the organs of sickle mice. Western blots for HO-1 were performed on organ homogenates (1 μg of organ DNA per lane) from lungs, livers, and spleens of untreated normal, S + S-Antilles, and BERK mice. (A) The 32-kDa HO-1 bands are shown for each organ and each mouse. (B) The mean HO-1 band intensities (n = 4) ± SD are expressed as a percentage of those in normal control mice. *p < 0.05, normal versus sickle. Figure is taken from ref. .
FIG. 4.
FIG. 4.
Hemin injections further increase HO-1 expression in sickle mice. (A) HO-1 expression can be further upregulated in the organs of sickle mice with hemin treatment. S + S-Antilles mice were either untreated or injected with hemin (40 μmol/kg/d, IP) for 3 days. Twenty-four hours after the third injection, the organs were harvested, and Western blots for HO-1 were performed on lung, liver, and spleen homogenates (1 μg of organ homogenate DNA per lane). The mean HO-1 band intensities (n = 3) ± SD are expressed as a percentage of those in untreated S + S-Antilles mice (100%). Below each bar is a representative HO-1 band from the Western blot. *p < 0.05, untreated versus hemin. (B) HO-1 activity in normal and S + S-Antilles livers. HO-1 activity was measured in microsomes isolated from another group of normal and S + S-Antilles sickle mice. Mice were untreated, injected with hemin (40 μmol/kg/d, IP) for 3 days, or injected with hemin plus SnPP (40 μmol/kg/d of each porphyrin, IP) for 3 days. The results in triplicate are expressed as mean ± SEM picomoles of bilirubin generated per milligram microsomal protein per hour. *p < 0.05, normal versus sickle. (A, B) are taken from ref. .
FIG. 5.
FIG. 5.
Further upregulation of HO-1 by hemin inhibits NF-κB activation and VCAM-1 and ICAM-1 overexpression in the organs of sickle mice. S + S-Antilles mice were either untreated or injected with hemin (40 μmol/kg/d, IP) for 3 days. Twenty-four hours after the third injection, the organs were harvested from mice in ambient air. NF-κB activation was measured with EMSA, and VCAM-1 and ICAM-1 expression was measured with Western blotting in organ homogenates of the lungs, liver, and spleen of sickle mice. (A) The NF-κB, VCAM-1, and ICAM-1 bands are shown for each organ and each sickle mouse. (B) The bar graph shows the mean band intensity (n = 3 mice per group) ± SD for each organ treatment group. *p < 0.05, untreated versus hemin. Figure is taken from ref. .
FIG. 6.
FIG. 6.
Further upregulation of HO-1 by hemin inhibits hypoxia/reoxygenation–induced increases in leukocyte–endothelium interactions. S + S-Antilles mice with an implanted dorsal skin-fold chamber (DSFC) were treated with either placebo (saline) or hemin injections (40 μmol/kg/d, IP) for 3 days. Twenty-four hours after the third injection, leukocyte rolling and adhesion were measured in the subcutaneous venules at baseline in ambient air and again in the same venules after exposure of the mice to 1 h of hypoxia (7% O2/93% N2) and 1 h of reoxygenation in room air. Results are expressed as mean ± SEM percentage change in leukocyte rolling and adhesion after hypoxia/reoxygenation; n = 2 mice and a minimum of 20 venules per group. *p < 0.05, placebo versus hemin. Figure is taken from ref. .
FIG. 7.
FIG. 7.
Further upregulation of HO-1 by hemin inhibits stasis, and HO-1 inhibition by tin protoporphyrin IX (SnPP) exacerbates stasis in sickle mice. S + S-Antilles (A) and BERK (B) mice with an implanted DSFC were untreated, injected with hemin (40 μmol/kg/d, IP) for 3 days, or injected with SnPP (40 μmol/kg/d, IP) for 3 days. Twenty-four hours after the third injection, stasis was measured after 1 h of hypoxia (7% O2/93% N2) and 1 and 4 h of reoxygenation in room air; n = 3–10 mice and a minimum of 20 venules per mouse. *p < 0.05, untreated versus hemin or SnPP. The proportions of venules exhibiting stasis at each time point were compared by using a z test. Figure is taken from ref. .
FIG. 8.
FIG. 8.
Biliverdin or CO treatment inhibits NF-κB activation in the lungs of sickle mice. S + S-Antilles mice were untreated, treated with biliverdin injections (50 μmol/kg, IP, twice, at 16 and 2 h), or treated with inhaled CO (250 ppm in air for 1 h per day for 3 days). Two hours after the second biliverdin injection or 24 h after the third CO treatment, mice were exposed to 3 h of hypoxia (7% O2/93% N2) and 2 h of reoxygenation in room air. After 2 h of reoxygenation, the lungs were harvested, and NF-κB activation was measured in organ homogenates with EMSA; n = 3 mice per group. Below each bar is a representative NF-κB band from the EMSA. *p < 0.05, untreated versus biliverdin or CO. Figure is taken from ref. .
FIG. 9.
FIG. 9.
CO and biliverdin inhibit stasis in sickle mice. S + S-Antilles mice with an implanted DSFC were either untreated or treated with inhaled CO (250 ppm CO in air) for 1 h per day for 3 days or biliverdin injections (50 μmol/kg, IP, twice), at 16 and 2 h, before hypoxia. Twenty-four hours after the third CO treatment or 2 h after the second biliverdin injection, stasis was measured after 1 h of hypoxia (7% O2/93% N2) and 1 h of reoxygenation in room air; n = 3–10 mice and a minimum of 20 venules per mouse. *p < 0.05, untreated versus CO or biliverdin. The proportions of venules exhibiting stasis at each time point were compared by using a z test. Figure is taken from ref. .
FIG. 10.
FIG. 10.
HO-1-ADV increases HO-1 expression and inhibits stasis. Local administration of HO-1-ADV increases HO-1 expression (A) and inhibits hypoxia/reoxygenation–induced stasis (B) in the skin. S + S-Antilles sickle mice with an implanted DSFC were treated with either a rat HO-1-ADV construct (n = 3 mice and 84 venules) or an empty Control-ADV construct (n = 4 mice and 64 venules). The adenovirus constructs (2 × 107 MOI) in sterile saline were dripped onto the subcutaneous skin inside the DSFC. Forty-eight hours after adenovirus treatment, hypoxia/reoxygenation–induced stasis was measured (B). After measurement of stasis, the skin inside the DSFC window was harvested, and HO-1 expression was measured in the skin homogenates with Western blotting (A). Below each bar is a representative HO-1 band from the Western blot. *p < 0.05, Control-ADV versus HO-1-ADV. Figure is taken from ref. .

References

    1. Agarwal A. Kim Y. Matas A. Alam J. Nath K. Gas-generation systems in acute renal allograft rejection in the rat: co-Induction of heme oxygenase and nitric oxide synthase. Transplantation. 1996;61:93–98. - PubMed
    1. Akerström B. Tissue distribution of guinea pig alpha 1-microglobulin. Cell Mol Biol. 1983;29:489–495. - PubMed
    1. Alam J. Multiple elements within the 5′ distal enhancer of the mouse heme oxygenase-1 gene mediate induction by heavy metals. J Biol Chem. 1994;269:25049–25056. - PubMed
    1. Alam J. Camhi S. Choi AMK. Identification of a second region upstream of the mouse heme oxygenase-1 gene that functions as a basal level and inducer-dependent transcription enhancer. J Biol Chem. 1995;270:11977–11984. - PubMed
    1. Alam J. Den Z. Distal AP-1 binding sites mediate basal level enhancement and TPA induction of the mouse heme oxygenase-1 gene. J Biol Chem. 1992;267:21894–21900. - PubMed

Publication types

LinkOut - more resources