

Functional neural network analysis in frontotemporal dementia and Alzheimer's disease using EEG and graph theory
- PMID: 19698093
- PMCID: PMC2736175
- DOI: 10.1186/1471-2202-10-101
Functional neural network analysis in frontotemporal dementia and Alzheimer's disease using EEG and graph theory
Abstract
Background: Although a large body of knowledge about both brain structure and function has been gathered over the last decades, we still have a poor understanding of their exact relationship. Graph theory provides a method to study the relation between network structure and function, and its application to neuroscientific data is an emerging research field. We investigated topological changes in large-scale functional brain networks in patients with Alzheimer's disease (AD) and frontotemporal lobar degeneration (FTLD) by means of graph theoretical analysis of resting-state EEG recordings. EEGs of 20 patients with mild to moderate AD, 15 FTLD patients, and 23 non-demented individuals were recorded in an eyes-closed resting-state. The synchronization likelihood (SL), a measure of functional connectivity, was calculated for each sensor pair in 0.5-4 Hz, 4-8 Hz, 8-10 Hz, 10-13 Hz, 13-30 Hz and 30-45 Hz frequency bands. The resulting connectivity matrices were converted to unweighted graphs, whose structure was characterized with several measures: mean clustering coefficient (local connectivity), characteristic path length (global connectivity) and degree correlation (network 'assortativity'). All results were normalized for network size and compared with random control networks.
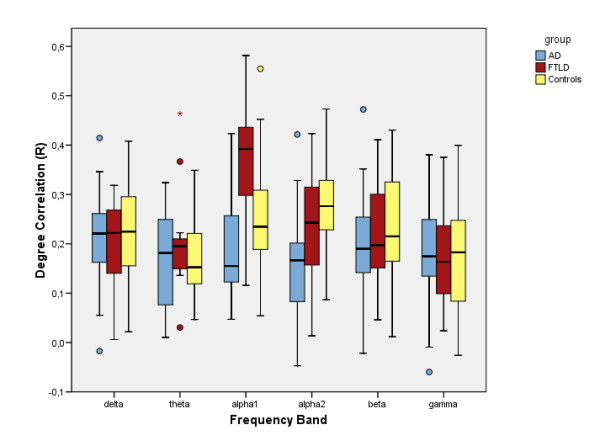
Results: In AD, the clustering coefficient decreased in the lower alpha and beta bands (p < 0.001), and the characteristic path length decreased in the lower alpha and gamma bands (p < 0.05) compared to controls. In FTLD no significant differences with controls were found in these measures. The degree correlation decreased in both alpha bands in AD compared to controls (p < 0.05), but increased in the FTLD lower alpha band compared with controls (p < 0.01).
Conclusion: With decreasing local and global connectivity parameters, the large-scale functional brain network organization in AD deviates from the optimal 'small-world' network structure towards a more 'random' type. This is associated with less efficient information exchange between brain areas, supporting the disconnection hypothesis of AD. Surprisingly, FTLD patients show changes in the opposite direction, towards a (perhaps excessively) more 'ordered' network structure, possibly reflecting a different underlying pathophysiological process.
Figures


Similar articles
-
Investigation of resting-state EEG functional connectivity in frontotemporal lobar degeneration.Clin Neurophysiol. 2008 Aug;119(8):1732-1738. doi: 10.1016/j.clinph.2008.02.024. Epub 2008 May 19. Clin Neurophysiol. 2008. PMID: 18490193
-
Graph theoretical analysis of magnetoencephalographic functional connectivity in Alzheimer's disease.Brain. 2009 Jan;132(Pt 1):213-24. doi: 10.1093/brain/awn262. Epub 2008 Oct 24. Brain. 2009. PMID: 18952674
-
Loss of 'small-world' networks in Alzheimer's disease: graph analysis of FMRI resting-state functional connectivity.PLoS One. 2010 Nov 1;5(11):e13788. doi: 10.1371/journal.pone.0013788. PLoS One. 2010. PMID: 21072180 Free PMC article.
-
Network dysfunction in Alzheimer's disease: refining the disconnection hypothesis.Brain Connect. 2014 Jun;4(5):299-311. doi: 10.1089/brain.2014.0236. Brain Connect. 2014. PMID: 24796856 Free PMC article. Review.
-
Functional changes in brain oscillations in dementia: a review.Rev Neurosci. 2022 Jun 21;34(1):25-47. doi: 10.1515/revneuro-2022-0010. Print 2023 Jan 27. Rev Neurosci. 2022. PMID: 35724724 Review.
Cited by
-
Compensatory motor network connectivity is associated with motor sequence learning after subcortical stroke.Behav Brain Res. 2015 Jun 1;286:136-45. doi: 10.1016/j.bbr.2015.02.054. Epub 2015 Mar 8. Behav Brain Res. 2015. PMID: 25757996 Free PMC article.
-
Neuronal Network Topology Indicates Distinct Recovery Processes after Stroke.Cereb Cortex. 2020 Nov 3;30(12):6363-6375. doi: 10.1093/cercor/bhaa191. Cereb Cortex. 2020. PMID: 32728724 Free PMC article.
-
Altered resting state brain dynamics in temporal lobe epilepsy can be observed in spectral power, functional connectivity and graph theory metrics.PLoS One. 2013 Jul 26;8(7):e68609. doi: 10.1371/journal.pone.0068609. Print 2013. PLoS One. 2013. PMID: 23922658 Free PMC article.
-
Functional Re-organization of Cortical Networks of Senior Citizens After a 24-Week Traditional Dance Program.Front Aging Neurosci. 2018 Dec 21;10:422. doi: 10.3389/fnagi.2018.00422. eCollection 2018. Front Aging Neurosci. 2018. PMID: 30618727 Free PMC article.
-
Brain Connectivity and Graph Theory Analysis in Alzheimer's and Parkinson's Disease: The Contribution of Electrophysiological Techniques.Brain Sci. 2022 Mar 18;12(3):402. doi: 10.3390/brainsci12030402. Brain Sci. 2022. PMID: 35326358 Free PMC article. Review.
References
-
- Börner K, Sanyal S, Vespignani A. Network Science. Annu Rev Inform Sci Technol. 2007;41:537–607. doi: 10.1002/aris.2007.1440410119. - DOI
MeSH terms
LinkOut - more resources
Full Text Sources
Other Literature Sources
Medical
