. 2009;10(8):R85.
doi: 10.1186/gb-2009-10-8-r85. Epub 2009 Aug 21.

Community-wide analysis of microbial genome sequence signatures

Affiliations

Community-wide analysis of microbial genome sequence signatures

Gregory J Dick et al. Genome Biol. 2009.

Abstract

Background: Analyses of DNA sequences from cultivated microorganisms have revealed genome-wide, taxa-specific nucleotide compositional characteristics, referred to as genome signatures. These signatures have far-reaching implications for understanding genome evolution and potential application in classification of metagenomic sequence fragments. However, little is known regarding the distribution of genome signatures in natural microbial communities or the extent to which environmental factors shape them.

Results: We analyzed metagenomic sequence data from two acidophilic biofilm communities, including composite genomes reconstructed for nine archaea, three bacteria, and numerous associated viruses, as well as thousands of unassigned fragments from strain variants and low-abundance organisms. Genome signatures, in the form of tetranucleotide frequencies analyzed by emergent self-organizing maps, segregated sequences from all known populations sharing < 50 to 60% average amino acid identity and revealed previously unknown genomic clusters corresponding to low-abundance organisms and a putative plasmid. Signatures were pervasive genome-wide. Clusters were resolved because intra-genome differences resulting from translational selection or protein adaptation to the intracellular (pH approximately 5) versus extracellular (pH approximately 1) environment were small relative to inter-genome differences. We found that these genome signatures stem from multiple influences but are primarily manifested through codon composition, which we propose is the result of genome-specific mutational biases.

Conclusions: An important conclusion is that shared environmental pressures and interactions among coevolving organisms do not obscure genome signatures in acid mine drainage communities. Thus, genome signatures can be used to assign sequence fragments to populations, an essential prerequisite if metagenomics is to provide ecological and biochemical insights into the functioning of microbial communities.


Figures
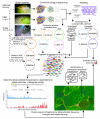
Figure 1
Figure 1
Overview of samples, data, and methods. MDA, Multiple Displacement Amplification. Lo et al. 2007 [55]; Tyson et al. 2004 [16]; Allen et al. 2007 [8]; Edwards et al. 2000 [57].
Figure 2
Figure 2
Phylogenetic tree of 16S rRNA gene sequences from Iron Mountain community genome sequencing (red) and selected sequences from cultivated organisms. Ferroplasma types I/II are not shown due to their near-identical sequences to F. acidarmanus. Sequences for which only partial coverage of the 16S rRNA gene was obtained are not shown, including ARMAN-5, a gammaproteobacterium, additional Actinobacteria, and Sulfobacillus-like sequences.
Figure 3
Figure 3
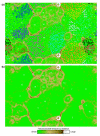
ESOM of genomic sequence fragments based on tetranucleotide frequency (5-kb window size; all contigs > 2 kb were considered). Note that the map is continuous from top to bottom and side to side. (a) Each point represents a sequence fragment; sequences whose origin is known (from assembly information) are colored as indicated below. Unassigned sequences are shown in green. Regions are numbered as follows: (1) ARMAN-2, brown; (2) Ferroplasma (F. acidarmanus fer1, dark orange; fer1(env), orange; fer2(env), light orange); (3) I-plasma, purple; (4) Leptospirillum group II, light blue; (5) Leptospirillum group III, pink; (6) A-plasma, navy blue; (7) E-plasma, light purple; (8) G-plasma, turquoise; (9) ARMAN-4, black; (10) ARMAN-5, red. Regions 11 to 17 are novel genomic regions identified in this study: (11) putative Leptospirillum plasmid; (12) A-plasma variant and C-plasma; (13) D-plasma; (14) Leptospirillum group III variant; (15) an actinobacterium; (16) mixed Actinobacteria; (17) mixed low-abundance bacteria, including Sulfobacillus spp., other Firmicutes, and a gammaproteobacterium. (b) Topography (U-Matrix) representing the structure of the underlying tetranucleotide frequency data from (a). 'Elevation' represents the difference in tetranucleotide frequency profile between nodes of the ESOM matrix (see legend); high 'elevations' (brown, white) indicate large differences in tetranucleotide frequency and thus represent natural divisions between taxonomic groups.
Figure 4
Figure 4
Ability of tetra-ESOM to resolve AMD populations as a function of evolutionary distance (average amino acid identity) and %GC. Black points represent comparisons between genomes with different %GC (> 2% different), red points are genome pairs with < 2% different %GC. These data were collected using a 5-kb window size and 2-kb cutoff length.
Figure 5
Figure 5
Schematic of how tetranucleotide frequency relates to reading frame and potential codons. (a) Tetranucleotide frequencies are calculated independently of reading frame with a 1-bp sliding window; thus, they may sample a complete codon or span two partial codons. (b) Because reverse complementary pairs are summed together, both strands are sampled. Therefore, depending on the coding strand and reading frame, there are 12 potential codons sampled by each tetranucleotide.
Figure 6
Figure 6
Tetranucleotide frequency predicted by codon abundance (a weighted average of the frequencies of the 12 potential codons associated with each tetranucleotide) versus observed tetranucleotide frequency. (a) Color indicates the genome of origin (using the same color scheme as Figure 3). (b) Palindromic nucleotides are indicated in red. R2 indicates the square of the Pearson correlation coefficient.

References

    1. Konstantinidis KT, Tiedje JM. Towards a genome-based taxonomy for prokaryotes. J Bacteriol. 2005;187:6258–6264. doi: 10.1128/JB.187.18.6258-6264.2005. - DOI - PMC - PubMed
    1. Konstantinidis KT, Tiedje JM. Genomic insights that advance the species definition for prokaryotes. Proc Natl Acad Sci USA. 2005;102:2567–2572. doi: 10.1073/pnas.0409727102. - DOI - PMC - PubMed
    1. Achtman M, Wagner M. Microbial diversity and the genetic nature of microbial species. Nat Rev Microbiol. 2008;6:431–440. doi: 10.1038/nrmicro1872. - DOI - PubMed
    1. Doolittle WF. Phylogenetic classification and the universal tree. Science. 1999;284:2124–2128. doi: 10.1126/science.284.5423.2124. - DOI - PubMed
    1. Allen EE, Banfield JF. Community genomics in microbial ecology and evolution. Nat Rev Microbiol. 2005;3:489–498. doi: 10.1038/nrmicro1157. - DOI - PubMed

Publication types