

Phylogenetic inference under varying proportions of indel-induced alignment gaps
- PMID: 19698168
- PMCID: PMC2746219
- DOI: 10.1186/1471-2148-9-211
Phylogenetic inference under varying proportions of indel-induced alignment gaps
Abstract
Background: The effect of alignment gaps on phylogenetic accuracy has been the subject of numerous studies. In this study, we investigated the relationship between the total number of gapped sites and phylogenetic accuracy, when the gaps were introduced (by means of computer simulation) to reflect indel (insertion/deletion) events during the evolution of DNA sequences. The resulting (true) alignments were subjected to commonly used gap treatment and phylogenetic inference methods.
Results: (1) In general, there was a strong--almost deterministic--relationship between the amount of gap in the data and the level of phylogenetic accuracy when the alignments were very "gappy", (2) gaps resulting from deletions (as opposed to insertions) contributed more to the inaccuracy of phylogenetic inference, (3) the probabilistic methods (Bayesian, PhyML & "MLepsilon, " a method implemented in DNAML in PHYLIP) performed better at most levels of gap percentage when compared to parsimony (MP) and distance (NJ) methods, with Bayesian analysis being clearly the best, (4) methods that treat gapped sites as missing data yielded less accurate trees when compared to those that attribute phylogenetic signal to the gapped sites (by coding them as binary character data--presence/absence, or as in the MLepsilon method), and (5) in general, the accuracy of phylogenetic inference depended upon the amount of available data when the gaps resulted from mainly deletion events, and the amount of missing data when insertion events were equally likely to have caused the alignment gaps.
Conclusion: When gaps in an alignment are a consequence of indel events in the evolution of the sequences, the accuracy of phylogenetic analysis is likely to improve if: (1) alignment gaps are categorized as arising from insertion events or deletion events and then treated separately in the analysis, (2) the evolutionary signal provided by indels is harnessed in the phylogenetic analysis, and (3) methods that utilize the phylogenetic signal in indels are developed for distance methods too. When the true homology is known and the amount of gaps is 20 percent of the alignment length or less, the methods used in this study are likely to yield trees with 90-100 percent accuracy.
Figures
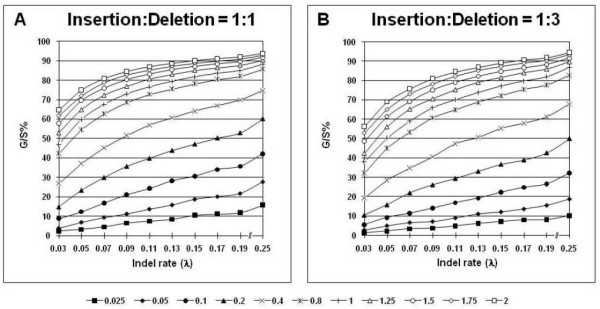
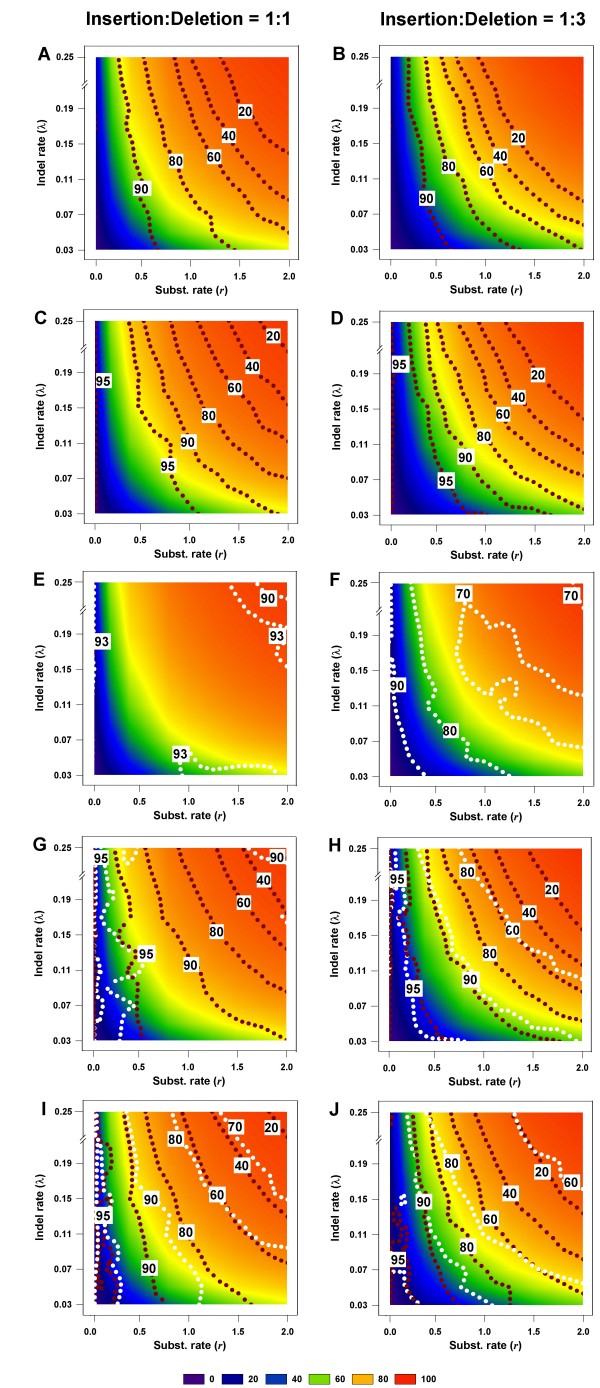
 plotted against different gap thresholds. In Panels E-F, and G-J, white dotted lines refers to the MLε method of Rivas and Eddy (2008), and the Binary Character state (BC) treatment, respectively. The dark red dotted lines refer to the Missing Data (MD) method in all panels. Each value reflects one of all possible combinations of values of substitution rate, r and indel rate, λ, (see Additional file 1), sequence length, l = 500, transition-transversion rate ratio, κ = 2, and the gamma among-site rate variation shape parameter, α = 0.5, averaged over 100 replicates, for a total of 110 data points in each graph. The left panels show the results for the insertion-deletion rate ratio of 1:1 and the right panels for the ratio 1:3.
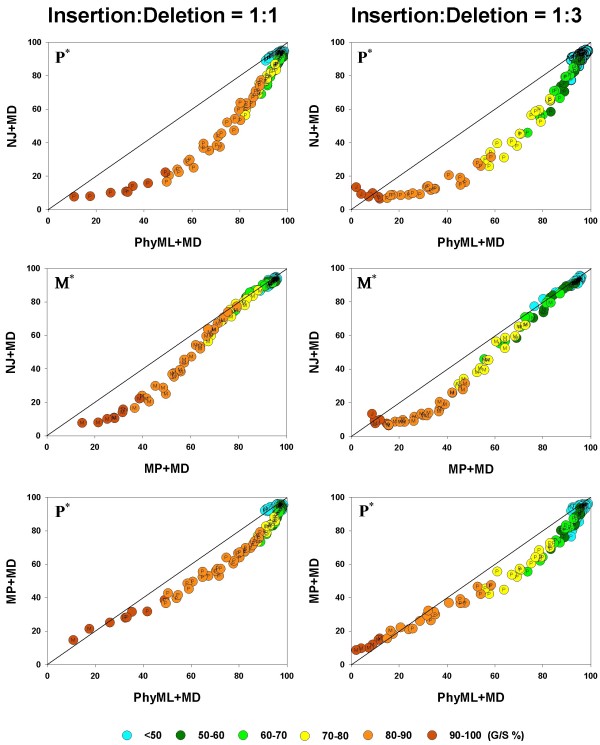 values are compared, in a pairwise fashion, for four inference methods: NJ, PhyML, and MP. As elsewhere, the left and right columns refer to the 1:1 and 1:3 insertion-deletion rate ratios. In each panel, the average phylogenetic accuracy, , for one inference method is plotted against that of another. The dots in each graph are color coded to reflect the gap percentage (G/S %) against which the values have been measured, ranging from light blue (for the lowest G/S values) to red (for the highest G/S values); see legend below figure. Each value reflects one of all possible combinations of values of substitution rate, r and indel rate, λ, (see Additional file 1), sequence length, l = 500, transition-transversion rate ratio, κ = 2, and the gamma among-site rate variation shape parameter, α = 0.5, averaged over 100 replicates, for a total of 110 data points in each graph. The paired t-test (p < 0.05) results are shown with a letter (within the dot) that signifies if a particular method is statistically better than the other in a given comparison (J – Neighbor-Joining, P – PhyML, and M – Maximum Parsimony) for the parameter combination. The t-test results that were not statistically significant are presented with no symbol (letter) within each dot. The results of the Z test (p < 0.001) over 110 data points for each method-method comparison is shown with a letter followed by an asterisk (J* – Neighbor-Joining, P* – PhyML, and M* – Maximum Parsimony)
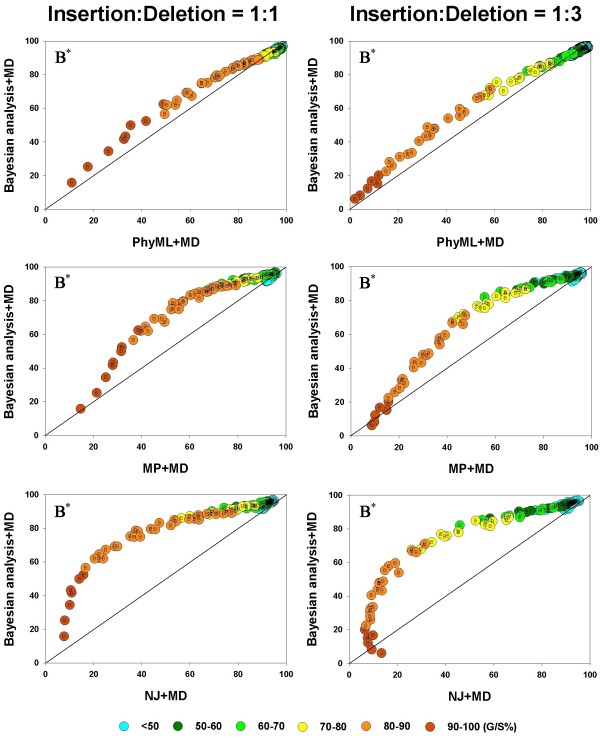 values are compared, in a pairwise fashion, for four inference methods: Bayesian analysis, NJ, PhyML, and MP. As elsewhere, the left and right columns refer to the 1:1 and 1:3 insertion-deletion rate ratios. In each panel, the average phylogenetic accuracy, , for one inference method is plotted against that of another. The dots in each graph are color coded to reflect the gap percentage (G/S %) against which the values have been measured, ranging from light blue (for the lowest G/S values) to red (for the highest G/S values); see legend below figure. Each value reflects one of all possible combinations of values of substitution rate, r and indel rate, λ, (see Additional file 1), sequence length, l = 500, transition-transversion rate ratio, κ = 2, and the gamma among-site rate variation shape parameter, α = 0.5, averaged over 100 replicates, for a total of 110 data points in each graph. The paired t-test (p < 0.05) results are shown with a letter (within the dot) that signifies if a particular method is statistically better than the other in a given comparison (B – Bayesian analysis, J – Neighbor-Joining, P – PhyML, and M – Maximum Parsimony) for the parameter combination. The t-test results that were not statistically significant are presented with no symbol (letter) within each dot. The results of the Z test (p < 0.001) over 110 data points for each method-method comparison is shown with a letter followed by an asterisk (B* – Bayesian analysis, J* – Neighbor-Joining, P* – PhyML, and M* – Maximum Parsimony)
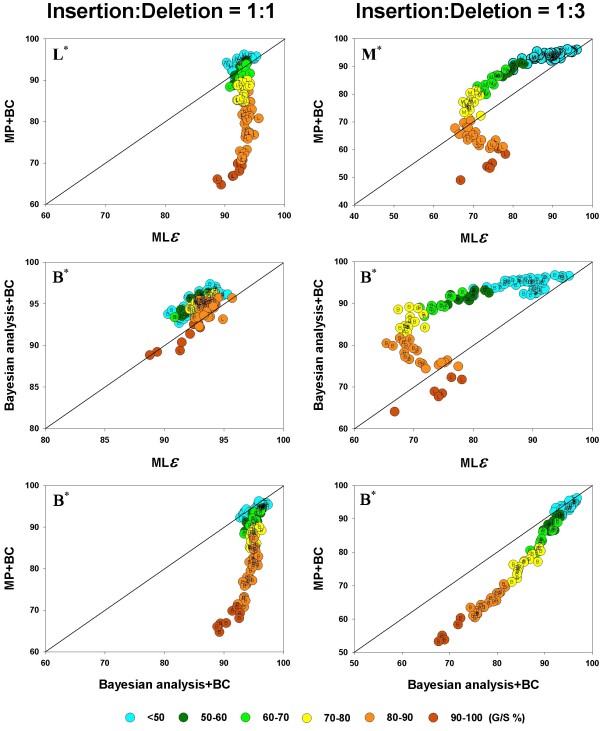 values are compared, in a pairwise fashion, for the inference methods: MP, Bayesian analysis, and the MLε analysis, when the gaps were treated as binary characters or by the DNAMLε method. As in Figure 4 and 5, the average phylogenetic accuracy, , for one method is plotted against that of another in each panel. For each pairwise comparison between the inference methods, the left panel shows the results for the insertion-deletion rate ratio is 1:1 and the right panel when it is 1:3. The dots in each graph are color coded to reflect the gap percentage (G/S) against which the values have been measured, ranging from light blue (for the lowest G/S values) to red (for the highest G/S values). Each value reflects one of all possible combinations of values of substitution rate, r and indel rate, λ, (see Additional file 1), sequence length, l = 500, transition-transversion rate ratio, κ = 2, and the gamma among-site rate variation shape parameter, α = 0.5, averaged over 100 replicates, for a total of 110 data points in each graph. The paired t-test (p < 0.05) results are shown with a letter (within the dot) that signifies if a particular method is statistically better than the other in a given comparison (B – Bayesian analysis, L -MLε, and M – Maximum Parsimony) for the parameter combination. The paired t-test results that were not significant are presented as dot with no symbol. The results of the Z test (p < 0.001) over 110 data points for each method-method comparison is shown with a letter followed by an asterisk (B* – Bayesian analysis, L* – MLε, and M* – Maximum Parsimony).
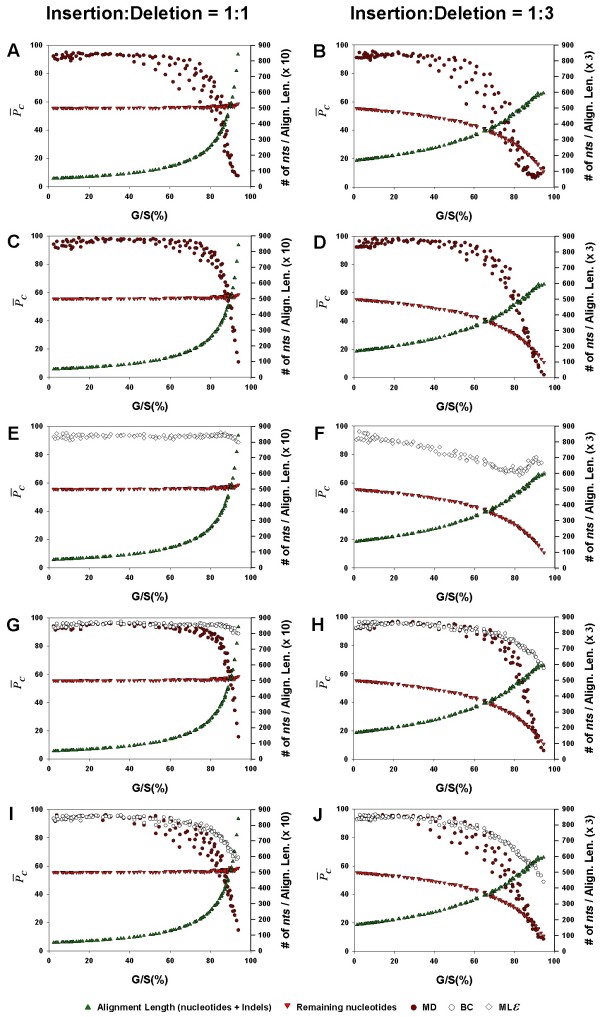 , (dark red circles for the MD treatment, open diamonds for the MLε method, and open circles for the BC treatment), remaining number of characters in the alignment after the gaps are removed (red inverted triangles), and the total length of the alignment (including gaps; symbolized by green, upright triangles), are each shown as a separate function of the average gap percentage, for NJ (Panels A, B), PhyML (C, D), MLε (E, F), Bayesian (G, H), and MP (I, J) inference methods. The left panels show the results for the insertion-deletion rate ratio of 1:1 and the right panels for the ratio 1:3. Each data point in the graph was obtained as the corresponding value for one of all possible combinations of values of r, the substitution rate and λ, the indel rate (see Additional file 1), sequence length (l = 500), transition-transversion rate ratio (κ = 2), and the gamma among-site rate variation shape parameter (α = 0.5), averaged over 100 replicates, for a total of 110 data points in each graph.
References
-
- Felsenstein J. Inferring Phylogenies. Sunderland: Sinauer Associates; 2004.
-
- Nei M, Kumar S. Molecular Evolution and Phylogenetics. Oxford: Oxford University Press; 2000.
-
- Hall BG. Phylogenetic trees made easy. A how-to manual, 2nd edition. Sunderland: Sinauer Associates; 2004.
-
- Swofford DL. PAUP*. Phylogenetic Analysis Using Parsimony (* and Other Methods). Version 4.0b10. Sunderland: Sinauer Associates; 2003. - PubMed
Publication types
MeSH terms
LinkOut - more resources
Full Text Sources
Miscellaneous
